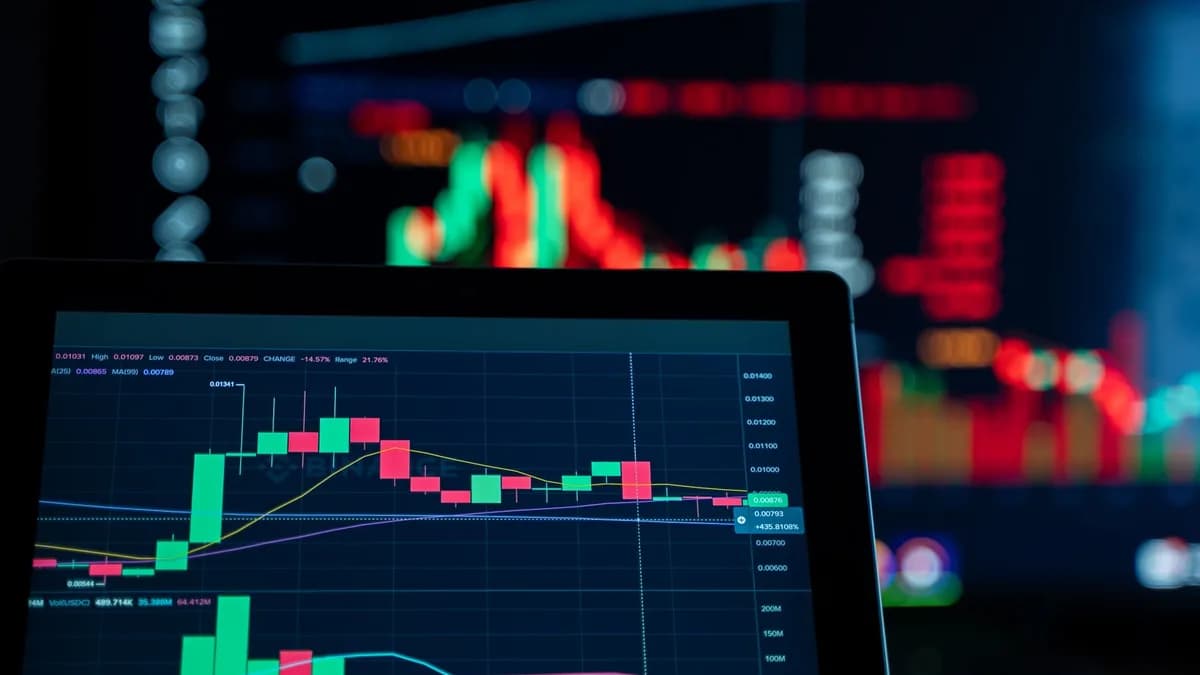
If you're an active trader tired of subscription fees and limited features, building your own stock trading dashboard in 2026 offers the ultimate solution. A customized dashboard gives you complete control over the data, layout, and tools you need, tailored to your specific trading style. Browser-based development platforms, free market data APIs, and professional templates have made creating a powerful, real-time dashboard more accessible than ever, eliminating the need for expensive proprietary software.
Why a Custom Dashboard Beats Generic Broker Platforms
While broker-provided platforms are convenient, they come with significant trade-offs. First, they bundle features together, forcing you to pay for tools you may never use while monthly subscription fees drain your trading capital, research by trading analysts suggests traders can spend an average of $1,800-3,600 per year on these platforms. Second, you sacrifice control and flexibility; your data resides in a proprietary system with limited customization and export options.
In 2026, creating a custom dashboard means you own your data and your infrastructure. You are not dependent on a vendor’s roadmap or pricing changes. As noted across technical guides, the flexibility to scale your toolset as your strategy evolves, without subscription traps, is a core advantage. For day traders, the ability to maintain separate layouts for scalping versus swing trading and access them from any browser on any device is a game-changer for decision speed.
A custom dashboard gives you complete ownership of your investment data and the flexibility to build exactly the dashboard you need, unlike web-based trackers that limit customization and lock your data inside a proprietary platform.
Core Components: Must-Have Data Feeds for Your Dashboard
A professional-grade trading dashboard is only as valuable as the data it displays. Based on evaluations of modern platforms and templates, here are the non-negotiable data feeds for 2026.
Real-Time Price & Market Data: Live prices are essential, and the standard has shifted to using WebSocket connections for true real-time, sub-second data streaming. Legacy polling methods that introduce delays are no longer acceptable for active trading. Free tiers from APIs like Finnhub or integration with broker APIs like Alpaca Markets can provide this foundational feed.
Portfolio Position Tracking: You need an at-a-glance view of all open positions, including entry price, current market value, unrealized P&L, and percentage allocation of your total portfolio. This module should update automatically with each price tick.
Technical Indicators: A core library of indicators (e.g., RSI, MACD, Bollinger Bands, ATR) should be calculable either from your data feed or through integrated libraries. Some advanced platforms in 2026 even integrate AI-powered indicator predictions, forecasting values like MACD crossovers or RSI levels 30 bars ahead.
News & Sentiment Feeds: Integrating a curated news feed or social sentiment data can provide context for price movements. This is often achieved through third-party API services.
Risk Management Metrics: Key widgets should display metrics like portfolio beta, position size based on your defined risk percentage, total portfolio heat, and concentration risk (e.g., top 5 holdings' allocation).
| Component | Essential Metrics | Recommended Data Source |
|---|---|---|
| Real-Time Prices | Current price, bid/ask, daily high/low, volume | Broker API (Alpaca), Finnhub (free tier), Polygon |
| Portfolio Tracking | Entry price, shares, market value, P&L, portfolio weight | Custom calculation from price feeds |
| Technical Analysis | RSI, MACD, 50/200-day SMAs, ATR, Bollinger Bands | Calculated via library (e.g., TradingView Lightweight Charts) or API |
| Risk Management | Portfolio beta, risk per trade %, total capital at risk | Custom calculations based on holdings and price data |
Step 1: Choosing Your Foundation (Streamlit, Dash, or Retool)
The foundation you choose dictates your development path. For a build stock trading dashboard 2026 project, three main avenues are prominent based on the source material.
1. Modern Web Frameworks (Next.js, React): The consensus for a production-grade, custom UI is to use a modern framework. The TradingView Lightweight Charts library is frequently cited as the "default for any developer building trading UI in 2026." It's a free, open-source library offering GPU-accelerated candlestick and line charts. Pairing it with a framework like Next.js allows for building a fully featured, responsive dashboard with WebSocket integration. A kit tailored for this purpose, focusing on real-time portfolio valuation and tax-lot accounting, is noted to be in development at the time of writing.
2. Dashboard-Specific Frameworks (Streamlit or Dash): For a Python-centric approach, Streamlit or Dash (by Plotly) are powerful choices. They are particularly strong for analytics-heavy dashbacks and leverage the Python data science stack (pandas, NumPy). However, sources note that these can result in dashboards that are "functional but not modern UX" and may be better suited for internal analytics than for a trader-facing application with a polished interface.
3. Low-Code Platforms (Retool or using Templates): If your goal is speed over granular control, starting with a pre-built template is effective. Several high-quality stock dashboard templates are available in 2026 for popular frameworks:
- TailAdmin V2: A highly customizable template built with Tailwind CSS V4, available in HTML, React, Next.js, Vue, Angular, and Laravel variants. It includes 500+ pre-built components.
- NextAdmin: A stylish template built with Tailwind CSS and Next.js.
- Vristo: A feature-rich React stock dashboard template with a component-based architecture.
These templates provide the UI scaffolding, charts, and data table components, allowing you to focus on connecting your data feeds.
Step 2: Connecting Market Data (Polygon, Alpaca, or Broker APIs)
A dashboard is useless without accurate, timely data. For a personal or professional dashboard in 2026, you have several established options.
Free Tiers & Retail Broker APIs: For developers and individual traders, Alpaca Markets provides free API access with a brokerage account, offering real-time and historical data. Finnhub also offers a free tier with rate limits. It's crucial to understand the legal and licensing distinctions: using data for personal use is straightforward, but redistributing real-time prices to the public requires formal exchange data licenses and involves fees.
Premium Data Providers: Services like Polygon.io offer robust, high-throughput market data APIs with clear professional pricing tiers. They are a common choice for more serious applications requiring extensive historical data or low-latency feeds.
Direct Broker Integration: If your dashboard is solely for managing your own accounts, connecting directly to your broker's API (like Interactive Brokers, TD Ameritrade, or Alpaca) can provide both data and trade execution capabilities. Be mindful that building trade execution features carries regulatory implications.
Implementation Note: In your code, you will establish a WebSocket client to connect to your chosen data provider. The connection should include logic for reconnection and error handling to maintain data flow during network issues.
# Example conceptual structure for a WebSocket data connection
import websocket
import json

def on_message(ws, message):
    data = json.loads(message)
    # Process real-time tick data: data['price'], data['symbol'], etc.
    update_dashboard(data)

def on_error(ws, error):
    print(f"Data feed error: {error}")
    # Implement reconnection logic here

def on_close(ws, close_status_code, close_msg):
    print("WebSocket connection closed")

# Establish connection to data provider's WebSocket endpoint
ws_app = websocket.WebSocketApp("wss://data.provider.com/v2/live",
                                on_message=on_message,
                                on_error=on_error,
                                on_close=on_close)
ws_app.run_forever()
Step 3: Integrating Real-Time News and Social Sentiment
Price action often follows news. Integrating a contextual news feed adds a critical layer of information. Many market data APIs (like Finnhub or Polygon) offer basic news endpoints. For more advanced sentiment analysis, specialized NLP APIs can scan headlines or social media for positive/negative sentiment scores on specific tickers.
This component is typically displayed in a dedicated widget or sidebar, listing filtered headlines relevant to the symbols in your watchlist or portfolio. The key is ensuring the news feed is tightly integrated so you can quickly correlate price spikes or drops with breaking news.
Step 4: Adding Technical Indicators and Custom Alerts
With price data flowing in, you can compute indicators. You have two primary paths:
1. Client-Side Calculation: Use a financial library in your chosen language. In a Python dashboard (Streamlit/Dash), libraries like pandas-ta can calculate RSI, MACD, etc., from your data stream. In a JavaScript/React dashboard, libraries such as technicalindicators can perform these calculations.
2. Integrated Charting Library: The most streamlined method is to leverage a professional charting library that handles indicator calculation and rendering natively. TradingView Lightweight Charts, while primarily a rendering library, is designed to work seamlessly with indicator data series.
Custom Alerts: Your dashboard should allow you to set alerts based on these indicators (e.g., "Alert me when AAPL RSI crosses below 30"). These alerts need to be server-side or persist in your application's state, so they trigger even when your dashboard browser tab is closed. Notification can be via browser push, email, or SMS using third-party services.
Critical feature: server-side alerts that trigger even when your browser is closed. This is non-negotiable for swing traders who can't watch screens all day.
Step 5: Visualizing Portfolio Performance and Risk Metrics
This is where your dashboard delivers high-level insight. You need to move beyond a simple list of holdings to dynamic visualizations.
Core Performance Visuals:
- Equity Curve: A line chart plotting your total portfolio value over time.
- Sector Allocation: A pie or bar chart showing your exposure to Technology, Healthcare, Financials, etc., using sector data from your API.
- Daily P&L Breakdown: A bar chart showing realized gains/losses per day.
Advanced Risk Metrics to Calculate & Display:
- Portfolio Beta: The weighted-average beta of all holdings, indicating sensitivity to the broader market. Formula:
=SUMPRODUCT(Position_Weights, Stock_Betas). - Concentration Risk: Display the percentage of total portfolio value held in your top 3 or top 5 positions.
- Value at Risk (VaR): A more advanced metric estimating potential portfolio loss over a given time frame at a certain confidence level.
You can build a scoring model within your dashboard, grading each holding based on value (P/E, P/B), quality (ROE, debt/equity), and momentum (price vs. moving averages) to get a quick, at-a-glance assessment of your portfolio's composition.
Step 6: Deployment Options: Local, Cloud, or VPS
Once built, you need to host your dashboard so it's always accessible.
- Local Machine: Simple for personal use, but your dashboard is only available when your computer is on and connected. Not suitable for mobile access or server-side alerts.
- Cloud Platforms (VPS/Dedicated Server): For a full-stack application (e.g., Next.js app with a backend), deploying to a Virtual Private Server (VPS) from providers like DigitalOcean, AWS Lightsail, or Linode is the standard. This allows for 24/7 access, reliable server-side alert processing, and better performance. Expect costs starting from $5-10 per month.
- Cloud Serverless/Hosting: For simpler dashboards built with Streamlit or static sites, you can use their respective cloud hosting services (Streamlit Cloud, Vercel, Netlify). These are often very low-cost or free for basic use but may have limitations on persistent WebSocket connections or background tasks.
Example Dashboard Templates for Different Trading Styles
Your trading style should dictate your dashboard layout. Here are conceptual templates based on 2026 tooling:
Day Trader / Scalper Layout:
- Primary Widget: A large, multi-chart layout (4-8 panes) showing different timeframes (1-min, 5-min) for your primary watchlist symbol.
- Secondary Widgets: A compact, real-time watchlist with price, change %, and volume. A one-click order entry panel with pre-set share sizes. A prominent risk calculator showing max position size.
- Foundation: A high-performance framework like Next.js with TradingView Lightweight Charts, deployed on a VPS for lowest latency.
Swing Trader / Investor Layout:
- Primary Widget: A detailed portfolio overview table showing holdings, cost basis, unrealized P&L, dividend yield, and fundamental metrics (P/E, ROE).
- Secondary Widgets: A sector allocation pie chart. A news feed filtered for portfolio holdings. A chart showing the portfolio equity curve vs. a benchmark (e.g., SPY).
- Foundation: Can be effectively built using a robust template like TailAdmin or Vristo, connected to data APIs and hosted in the cloud.
Quantitative Analyst Layout:
- Primary Widget: Backtesting results visualization with performance metrics (Sharpe ratio, max drawdown).
- Secondary Widgets: Scatter plots of factor exposures, correlation matrices of holdings, and real-time signal monitors.
- Foundation: Python with Streamlit or Dash is ideal for leveraging pandas, NumPy, and statistical libraries for complex analysis and visualization.
Maintaining and Scaling Your Custom Dashboard
Building the dashboard is the first step; maintaining it is an ongoing process.
- Monitor API Costs: As your usage grows, free tier limits may be exceeded. Keep an eye on the pricing tiers of your data providers Alpaca, Finnhub, or Polygon.
- Update for Compliance: If you add features like sharing trade ideas or automated order routing, be aware of regulatory landscapes (SEC/FINRA). Sources strongly advise consulting a securities lawyer before launching any public-facing trading tool.
- Refactor for Performance: As you add more indicators, charts, and real-time data streams, optimize your code and consider upgrading your hosting plan to maintain sub-second responsiveness.
- Backup Your Data: Ensure your portfolio holdings and trade history are regularly backed up, especially if stored in a cloud database or spreadsheet.
FAQ
What is the best free data source for building a stock dashboard in 2026? For stocks, Alpaca Markets provides a free API with a brokerage account. Finnhub also offers a free tier with rate limits. For an all-in-one solution with real-time data, PredictIndicators.ai's web app provides browser-based access to prices and AI-powered indicator forecasts without requiring a separate data subscription.
Do I need a license to show real-time stock prices on a public website? Yes, this is legally complex. Displaying real-time stock prices (direct from NYSE/Nasdaq feeds) to the public typically requires formal data redistribution licenses and fees. For personal use or for dashboards using delayed data (e.g., 15-minute delay), the rules are much simpler. Always seek specific legal advice if building a public product.
Can I use Excel to build a trading dashboard?
Absolutely. Microsoft Excel, enhanced with a toolkit like MarketXLS, can create a powerful, fully customizable portfolio dashboard. It allows for real-time streaming via =Stream_Last(), fundamental analysis with formulas like =PERatio(), and technical indicators like =RSI(). It excels at ownership of data, custom calculations, and offline access, though it lacks the seamless web accessibility of a browser-based app.
Is dark mode important for a trading dashboard? Yes, it's considered table stakes in 2026. Traders spend long hours staring at screens, and dark mode reduces eye strain. Most professional templates and charting libraries, like TradingView Lightweight Charts, support dark themes natively. A dashboard without a dark mode option may be viewed as less professional.
How many screens or views should a basic trading dashboard have? Analysis of production templates suggests a minimum of around 18 distinct screens or views. These typically cover: a main overview, detailed portfolio analysis, individual chart views for each symbol, watchlist management, order entry, order history, alerts management, news feeds, reporting tools (tax, performance), and user settings.
Bottom Line
Building your own stock trading dashboard in 2026 is a powerful way to gain an edge. It moves you from being a user of generic tools to the architect of a system perfectly tailored to your strategy. The ecosystem provides all the necessary components: high-quality dashboard templates like TailAdmin or Vristo for the frontend, robust and often free APIs from Alpaca or Finnhub for data, and professional charting libraries like TradingView Lightweight Charts. Whether you choose a sophisticated Next.js application, a Python Streamlit dashboard, or even an advanced Excel workbook with MarketXLS, you can create a professional, real-time command center that puts you in full control of your trading decisions and your data.