A technical analysis workflow for stocks is not just a chart full of indicators. It is a repeatable process for moving from market scan, to chart review, to alerts, to broker execution, and finally to post-trade review. The goal is consistency: the same inputs, the same decision rules, and the same review loop each trading day.
Technical analysis itself is based on price, volume, chart patterns, and indicators. The research sources define it as a method of evaluating securities by analyzing market activity — mainly price and volume — rather than company fundamentals such as revenue or earnings. A good workflow turns those concepts into a practical routine you can actually follow.
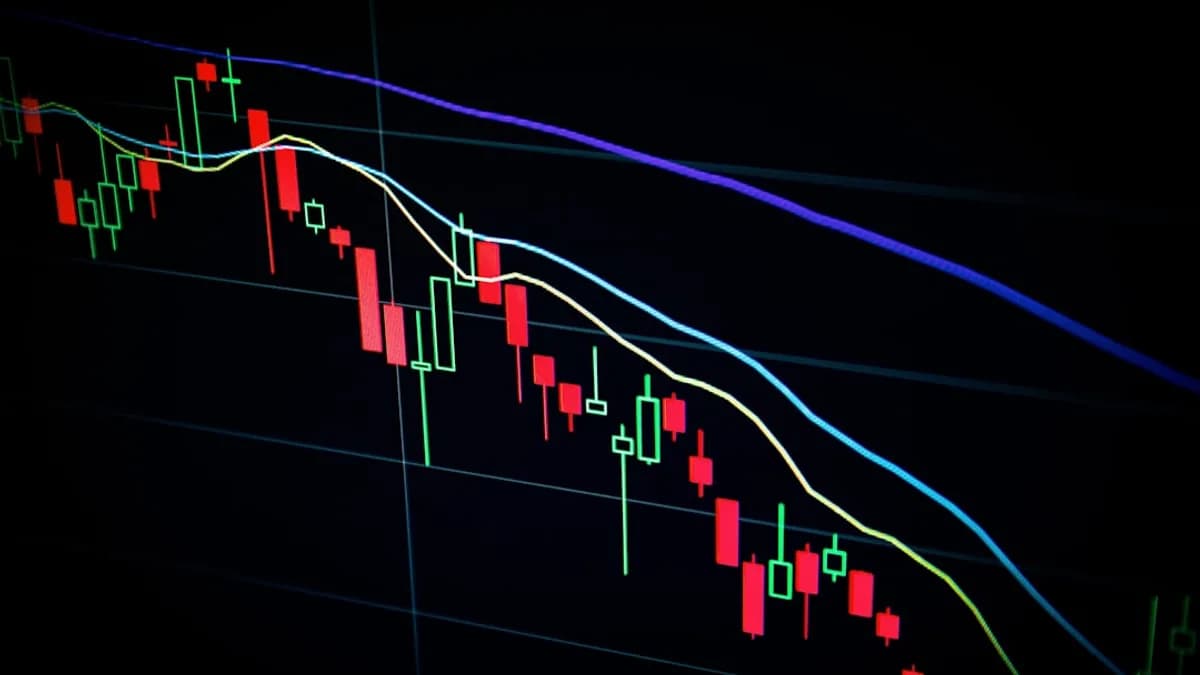
What a Technical Analysis Workflow Should Include
A useful technical analysis workflow for stocks should answer five questions before you place a trade:
- What is the market doing?
- Which stocks are worth watching?
- What does the chart say across key timeframes?
- What exact condition would trigger action?
- What happened after the trade, and what should be improved?
Technical analysis rests on three core principles repeated across the research sources:
| Principle | Meaning for Your Workflow |
|---|---|
| Price discounts everything | Your chart review should focus on what price and volume are showing now. |
| Price moves in trends | Your first job is to classify the stock as trending up, trending down, or range-bound. |
| History tends to repeat itself | Your workflow should look for repeatable patterns, but never assume certainty. |
Key warning: Technical analysis is not fortune-telling. The source data explicitly notes that no indicator or chart pattern can predict the future with certainty. The purpose is to create a structured framework for higher-probability decisions.
A complete workflow usually includes these layers:
| Workflow Layer | What It Does | Examples From the Source Data |
|---|---|---|
| Market filter | Checks broad conditions before individual stocks | Major indices such as the Dow Jones Industrial Average and S&P 500 are commonly tracked in market analysis. |
| Watchlist | Narrows attention to relevant stocks or groups | Stock groups can be analyzed together using tools such as the stock-analysis Python package. |
| Chart review | Identifies trend, support breaks, resistance, and patterns, such as an AUD/USD support test or an XRP $1.10 support defense | Candlesticks, trend lines, moving averages, RSI, MACD, Bollinger Bands, and volume indicators. |
| Scanner or screener | Finds stocks matching technical conditions | The research mentions technical analysis screeners and advanced screeners in charting platforms. |
| Alerts | Notifies you when predefined price or indicator conditions occur | TradingView paid plans unlock custom alerts, according to the source data. |
| Broker execution | Handles order placement | Broker-specific integrations are not detailed in the provided source data, so keep this layer focused on execution discipline. |
| Journal and review | Records decisions and outcomes | Use chart notes, trade logs, and post-trade metrics such as volatility, beta, or visual review. |
The most important idea is sequencing. Do not begin with an indicator. Start with market context, then move to watchlists, charts, alerts, execution, and review.
Choosing a Primary Charting Platform
Your charting platform is the center of the workflow because most technical decisions depend on visual price structure. The sources identify TradingView as a popular charting platform for applying moving averages, indicators, and technical analysis across markets.
The same source notes that TradingView’s free tier provides access to powerful charts, while paid plans unlock multi-timeframe analysis, custom alerts, and advanced screeners. The source does not provide specific pricing, so pricing should be checked directly at the time of writing.
Charting Platform Options by Role
| Option | Best Use in the Workflow | Source-Supported Details |
|---|---|---|
| TradingView | Primary visual charting, indicators, alerts, screeners | Free tier includes powerful charts; paid plans unlock multi-timeframe analysis, custom alerts, and advanced screeners. |
| stock-analysis Python package | Custom research, visualization, group analysis, modeling | Supports ticker data, index data, candlestick plots, correlation heatmaps, volatility, beta, ARIMA, and regression examples. |
| n8n stock analysis workflows | Automated report generation | Source snippets mention workflows using data sources such as Chart-img, Twelve Data API, Alphavantage, technical indicators, and news sentiment. |
For most traders, the practical choice is to use one visual charting platform as the “source of truth” for charts. If you use too many charting tools, you risk having different layouts, different indicator settings, and conflicting signals.
Workflow rule: Choose one primary charting environment, then use other tools only for scanning, automation, execution, or review.
What Your Main Charting Platform Needs
Based on the source data, prioritize these charting capabilities:
- Candlestick charts: Candlesticks show open, high, low, and close for each period.
- Volume display: Volume helps confirm support, resistance, and pattern significance.
- Moving averages: Common examples include the 20-day SMA, 50-day SMA, 200-day SMA, and EMAs such as 9, 12, 21, and 26.
- Momentum indicators: RSI, MACD, stochastic oscillator, and rate of change are all discussed in the research.
- Volatility indicators: Bollinger Bands and ATR can help frame changing volatility.
- Multi-timeframe review: Paid TradingView plans are described as unlocking multi-timeframe analysis.
- Alerts: Custom alerts are specifically mentioned as a paid TradingView feature.
Do not select a platform because it has the most indicators. The source data warns that using too many indicators can lead to analysis paralysis.
Setting Up Watchlists, Sectors, and Market Filters
A strong technical analysis workflow for stocks begins before you open an individual chart. You need a filtering process so you are not randomly jumping between tickers.
The source data on 2026 market analysis highlights broad index behavior, including the Dow Jones Industrial Average and S&P 500, and notes that modern stock analysis increasingly combines AI-powered data tools, advanced charting platforms, and algorithmic insights. However, it also warns that valuation concerns and macro uncertainty may increase volatility.
That means your workflow should start with a top-down check.
Step 1: Check Broad Market Direction
Use broad index charts to answer:
- Trend: Is the index in an uptrend, downtrend, or sideways range?
- Moving averages: Is price above or below widely watched levels such as the 50-day or 200-day moving average?
- Support and resistance: Is price approaching a major floor or ceiling?
- Volatility: Are Bollinger Bands widening or narrowing? Is ATR elevated?
The source data explains that a 50-day SMA is commonly used for the medium-term trend and a 200-day SMA is often viewed as a long-term dividing line between bullish and bearish conditions for a stock.
Step 2: Build Watchlists by Technical Purpose
Instead of one giant list, create focused watchlists. The sources do not prescribe exact sector categories, but they do support grouping assets and analyzing groups through the stock-analysis package.
For example, your watchlists can be organized by:
- Trend leaders: Stocks making higher highs and higher lows.
- Pullback candidates: Stocks near moving average support.
- Breakout candidates: Stocks testing resistance.
- Range-bound names: Stocks oscillating between horizontal support and resistance.
- High-volume setups: Stocks where volume confirms price action.
Step 3: Use Group-Level Review
The stock-analysis package supports grouping assets, building a portfolio-like grouped dataset, and visualizing correlation heatmaps. This can help you understand whether several watchlist names are moving together.
Example workflow using the package structure shown in the source data:
from stock_analysis import StockReader
from stock_analysis.utils import group_stocks, describe_group
from stock_analysis import AssetGroupVisualizer

reader = StockReader('2026-01-01', '2026-12-31')

aapl = reader.get_ticker_data('AAPL')
amzn = reader.get_ticker_data('AMZN')
goog = reader.get_ticker_data('GOOG')

watchlist = group_stocks({
    'Apple': aapl,
    'Amazon': amzn,
    'Google': goog
})

describe_group(watchlist)

watchlist_viz = AssetGroupVisualizer(watchlist)
watchlist_viz.heatmap(True)
This is not a replacement for chart reading. It is a supporting layer for understanding group behavior and correlation.
Creating Indicator Templates and Chart Layouts
Your chart layout should make decisions easier, not more complicated. The source data gives a clear warning: using too many indicators can create conflicting signals and analysis paralysis.
A practical template should include one or two tools from each category:
| Category | Source-Supported Tools | Purpose |
|---|---|---|
| Trend | SMA, EMA, MACD, ADX | Identify direction and trend strength. |
| Momentum | RSI, stochastic oscillator, ROC | Identify overbought, oversold, or momentum shifts. |
| Volatility | Bollinger Bands, ATR | Understand range expansion, contraction, and volatility. |
| Volume | OBV, VPT, accumulation/distribution line | Confirm buying or selling pressure. |
| Structure | Support, resistance, trend lines, chart patterns | Define key decision levels. |
Start With Price Structure
Before indicators, mark:
- Support: A price level where buying pressure has historically prevented further decline.
- Resistance: A price level where selling pressure has historically prevented further advance.
- Trend lines: Uptrend lines connect higher lows; downtrend lines connect lower highs.
- Round numbers: Levels such as $50, $100, and $200 often matter psychologically.
- Pattern zones: Triangles, flags, rectangles, double tops, double bottoms, head and shoulders, or cup-and-handle formations.
The research emphasizes that support and resistance are not magic lines. They work because many traders watch the same levels and act around them.
Add Moving Averages
Moving averages are described as among the most widely used indicators. They smooth price data and help identify the underlying trend.
| Moving Average | Source-Supported Use |
|---|---|
| 20-day SMA | Short-term trend, popular with swing traders. |
| 50-day SMA | Medium-term trend, widely watched by institutional traders. |
| 200-day SMA | Long-term trend reference. |
| 9, 12, 21, 26 EMAs | Common EMA periods; EMAs respond faster to recent prices. |
Two common moving-average signals are:
- Golden cross: The 50-day moving average crosses above the 200-day moving average, considered bullish.
- Death cross: The 50-day moving average crosses below the 200-day moving average, considered bearish.
The source data also stresses that moving averages are lagging indicators. They confirm trends but do not predict the future.
Add Momentum and Confirmation
Use momentum indicators only when they answer a specific question.
| Indicator | Source-Supported Interpretation |
|---|---|
| RSI | Measures speed and magnitude of price changes from 0 to 100. Above 70 is traditionally overbought; below 30 is traditionally oversold. |
| MACD | Shows the relationship between 12-day and 26-day EMAs; signal line is a 9-day EMA of MACD. |
| Stochastic oscillator | Readings above 80 are considered overbought; below 20 oversold. |
| ADX | Measures trend strength from 0 to 100; above 25 indicates a strong trend, below 20 suggests weak or sideways conditions. |
| Bollinger Bands | Typically use a 20-day SMA and outer bands set 2 standard deviations away. Narrow bands suggest low volatility; wide bands suggest high volatility. |
| ATR | Measures market volatility and can help traders assess price range behavior. |
A clean chart template might include:
- Price candles
- Volume
- 20-day SMA
- 50-day SMA
- 200-day SMA
- RSI or MACD
- Bollinger Bands or ATR
- Manually drawn support and resistance
That is enough for most daily decision-making. More indicators do not automatically mean better analysis.
Using Alerts Without Overloading Your Process
Alerts are useful only when they reduce screen time and enforce discipline. If every minor price movement triggers a notification, alerts become noise.
The source data specifically notes that TradingView paid plans unlock custom alerts. It also mentions n8n workflows that can generate automated stock analysis reports using data sources such as Chart-img, Twelve Data API, and Alphavantage, with technical indicators including RSI, MACD, Bollinger Bands, and resistance.
Build Alerts Around Decisions, Not Curiosity
Use alerts for levels where you already know what you will do next.
| Alert Type | Example Condition | Why It Helps |
|---|---|---|
| Support test | Price approaches a previously marked support zone | Prompts review of buyer reaction. |
| Resistance test | Price approaches a major resistance level | Prepares you to watch for breakout or rejection. |
| Moving average interaction | Price reaches the 50-day or 200-day moving average | Helps monitor dynamic support or resistance. |
| Momentum condition | RSI moves above 70 or below 30 | Flags possible overbought or oversold conditions. |
| Volatility expansion | Bollinger Bands widen after a narrow period | Signals changing volatility conditions. |
| Pattern completion | Price breaks a neckline, range boundary, or triangle level | Helps wait for confirmation rather than guessing early. |
Alert rule: Every alert should have a next action: review, ignore, prepare, or execute. If an alert does not change your behavior, remove it.
Avoid Alert Stacking
A common mistake is setting separate alerts for every indicator on every watchlist stock. That produces overlapping signals.
Instead, use a hierarchy:
- Market alerts: Broad index support, resistance, or moving average levels.
- Watchlist alerts: Key levels on your best setups.
- Trigger alerts: Pattern completion or breakout confirmation.
- Review alerts: End-of-day or weekly chart review reminders.
Automated workflows, such as the n8n stock analysis examples in the source snippets, can be useful for scheduled reports. But automation should summarize your process, not replace judgment.
Connecting Broker Platforms and Execution Tools
The source data does not provide broker-specific platform names, pricing, order types, or integration specifications. So the safest workflow recommendation is to separate chart analysis from execution decisions.
Your broker platform should be the place where you place and manage trades. Your charting platform should be the place where you define the technical setup.
Keep the Broker Layer Simple
Before sending an order, your workflow should confirm:
- Trend: Is the stock in an uptrend, downtrend, or range?
- Level: Is the trade occurring near support, resistance, a trend line, or a pattern completion point?
- Confirmation: Is volume supporting the move?
- Indicator context: Do moving averages, RSI, MACD, Bollinger Bands, or ADX support the thesis?
- Timeframe alignment: Does the setup make sense on the timeframe you trade?
The research notes that many traders will not enter a long position unless price is above the 50-day or 200-day moving average. That is not a universal rule, but it is an example of how a technical filter can prevent impulsive entries.
Use a Pre-Execution Checklist
A broker connection is only useful if your decision process is already defined. Use a checklist like this:
| Checklist Item | Question |
|---|---|
| Market context | Are broad index conditions supportive or risky? |
| Setup type | Is this a breakout, pullback, reversal, or range trade? |
| Support/resistance | What level invalidates the setup? |
| Volume | Is volume confirming the move? |
| Moving averages | Is price above or below key averages? |
| Momentum | Is RSI, MACD, or stochastic confirming or warning? |
| Volatility | Are Bollinger Bands or ATR showing unusual expansion? |
| Journal entry | Have you recorded the reason for the trade before execution? |
This keeps the broker from becoming a place where decisions are improvised.
Adding Trade Journaling and Post-Trade Review
A technical workflow is incomplete without review. Technical analysis depends on repeatable patterns, so you need a way to see which patterns you actually trade well.
The provided sources do not name a dedicated trade journaling platform. However, they do provide enough technical categories to design an effective journal.
What to Record in a Technical Trade Journal
| Journal Field | Why It Matters |
|---|---|
| Ticker | Identifies the stock. |
| Date and timeframe | Connects the trade to the chart context. |
| Market condition | Records whether broad indices were trending, weak, or volatile. |
| Setup type | Breakout, pullback, reversal, range trade, or pattern completion. |
| Support and resistance | Shows whether the trade was based on meaningful levels. |
| Trend state | Uptrend, downtrend, or sideways range. |
| Indicators used | Moving averages, RSI, MACD, Bollinger Bands, ADX, or volume tools. |
| Volume confirmation | Notes whether volume supported the setup. |
| Screenshot or chart note | Preserves what you saw at decision time. |
| Outcome review | Captures whether the original technical thesis worked. |
The most useful review question is not “Did this trade make money?” It is “Did I follow the setup I planned?”
Use Post-Trade Metrics Carefully
The stock-analysis package includes methods for calculating metrics such as annualized volatility and analyzing beta against an index. It also supports visual review tools such as candlestick plots, reference lines, shaded regions, correlation heatmaps, ARIMA examples, and regression examples.
A simple review layer could look like this:
from stock_analysis import StockReader, StockAnalyzer, StockVisualizer

reader = StockReader('2026-01-01', '2026-12-31')
stock = reader.get_ticker_data('NFLX')

analyzer = StockAnalyzer(stock)
volatility = analyzer.annualized_volatility()

viz = StockVisualizer(stock)
ax = viz.evolution_over_time(
    'close',
    figsize=(10, 4),
    legend=False,
    title='Closing price review'
)

print(volatility)
Use these tools to support your journal, not to overcomplicate it. The source repository itself describes the package as a starting point for developing your own analysis.
Weekly Review Routine
A practical weekly review can include:
- Review all closed trades
- Group trades by setup type
- Compare entries to support and resistance
- Check whether volume confirmed the idea
- Identify which indicators helped and which added noise
- Update templates, alerts, and watchlists
That review loop is what turns technical analysis from chart watching into a repeatable decision process.
Common Workflow Mistakes to Avoid
Even a good technical analysis workflow for stocks can fail if it becomes too complex or inconsistent. The source data highlights several pitfalls directly or indirectly.
1. Using Too Many Indicators
The research gives a clear caution: too many indicators can lead to analysis paralysis. Multiple indicators may also produce conflicting signals.
A better approach is to combine complementary tools:
- Trend: Moving averages or ADX
- Momentum: RSI or MACD
- Volatility: Bollinger Bands or ATR
- Volume: OBV, VPT, or accumulation/distribution
- Structure: Support, resistance, and trend lines
2. Trading Patterns Before Completion
The source data states that reliable patterns should be confirmed and that traders should wait for pattern completion before trading. For example, a head-and-shoulders pattern is not complete until price breaks below the neckline.
The same applies to:
- Double tops
- Double bottoms
- Triangles
- Flags and pennants
- Rectangles
- Cup-and-handle patterns
Do not assume the pattern will finish just because it resembles one in progress.
3. Ignoring Volume
The sources emphasize that volume confirms the significance of support, resistance, and patterns. A support level that holds on high volume shows stronger buyer conviction than a low-volume bounce.
Volume tools mentioned in the research include:
- On-Balance Volume
- Volume Price Trend
- Accumulation/Distribution Line
4. Treating Moving Averages as Predictions
Moving averages are lagging indicators. They show what has already happened. Their value is in trend confirmation and dynamic support or resistance, not prediction.
A price above the 50-day or 200-day moving average may support a bullish context, but it does not guarantee continuation.
5. Skipping Market Context
A stock setup can look strong while the broader market is weakening. The 2026 market source notes that major indices may be influenced by AI investment, earnings, Federal Reserve policy, valuation concerns, macro uncertainty, and volatility.
Your workflow should include broad index review before individual trade selection.
6. Letting Alerts Replace Analysis
Alerts should bring you back to a planned decision point. They should not make the decision for you.
If an alert fires, review:
- Price action
- Volume
- Support or resistance
- Trend direction
- Relevant indicators
- Pattern completion
7. Failing to Journal
Without a journal, every trade feels unique. With a journal, you can see whether your best trades come from pullbacks, breakouts, reversals, or range setups.
A journal also shows whether your indicators are genuinely helping or simply decorating the chart.
Bottom Line
A strong technical analysis workflow for stocks connects five layers: market context, watchlists, chart templates, alerts, execution, and review. The source data supports a disciplined process built around price, volume, trends, support and resistance, candlesticks, chart patterns, and a focused set of indicators.
Use a primary charting platform such as TradingView for visual analysis, alerts, and screeners where available. Add custom research tools such as the stock-analysis Python package only if they improve your review process. Keep broker execution separate from analysis, and use a journal to measure whether your setups are repeatable.
The best workflow is not the most complex one. It is the one you can follow consistently.
FAQ
What is a technical analysis workflow for stocks?
A technical analysis workflow for stocks is a repeatable process for scanning markets, reviewing charts, setting alerts, executing trades, and reviewing results. It is based on price, volume, trend, support and resistance, chart patterns, and indicators.
Which indicators should be included in a beginner workflow?
The source data supports starting with a small set of complementary indicators. Common choices include moving averages such as the 20-day, 50-day, and 200-day SMA, plus one momentum indicator like RSI or MACD, and one volatility tool such as Bollinger Bands or ATR.
Should I use TradingView for technical analysis?
The research identifies TradingView as a popular charting platform for applying moving averages, indicators, and technical analysis. Its free tier provides powerful charts, while paid plans unlock multi-timeframe analysis, custom alerts, and advanced screeners, according to the source data.
How many indicators are too many?
The source data warns that too many indicators can create analysis paralysis. A practical workflow should use only indicators that answer different questions, such as trend, momentum, volatility, and volume confirmation.
Are stock chart patterns reliable?
Chart patterns can help identify potential continuation or reversal setups, but they are not certain. The research emphasizes waiting for pattern completion and confirmation, especially around significant support or resistance and with volume support.
Do I need a trade journal for technical analysis?
Yes, if you want a repeatable process. The sources do not name a dedicated journaling platform, but they support recording chart structure, indicators, volume, trend, and post-trade outcomes so you can review which setups work best for your trading decisions.