
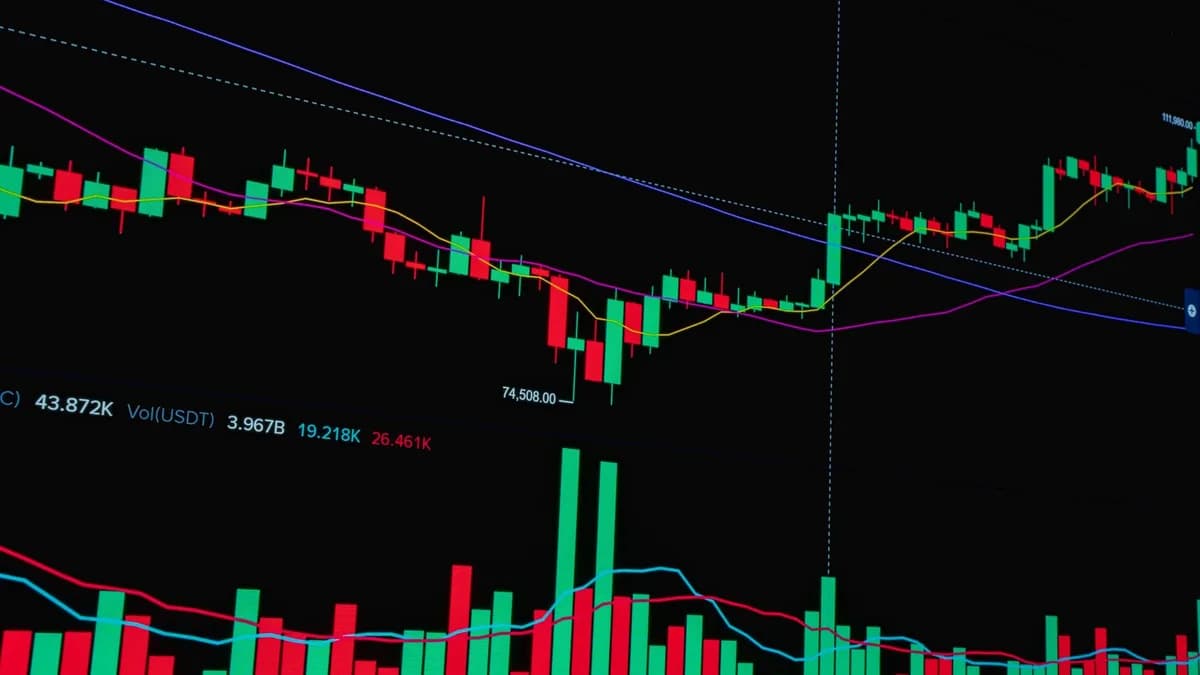
Bitcoin’s latest push toward $70,000 has stalled because crypto’s old nemesis is back: inflation fear. The $65,000 level has proven a stubborn barrier for the fourth consecutive day, according to CoinDesk, with traders now squarely focused on Wednesday's U.S. inflation data. This is the clearest signal yet that the post-ETF, post-halving euphoria is colliding with the persistent reality of Federal Reserve policy. The market is no longer trading in a crypto-only bubble.
Updated on August 11, 2026
XOOMAR Intelligence
Analyst Take
66/ 100
3 sources analyzedLow confidenceTrend10Freshness97Source Trust88Factual Grounding82Signal Cluster60
Crypto’s Rally Hits an Inflation-Soaked Wall
The immediate catalyst isn't inside crypto. It's in global energy markets and bond yields. Brent crude oil jumped 5% on Monday to $87.73, a rally tied to geopolitical tension with Iran. This matters because higher energy prices feed directly into consumer price calculations. The specter of resurgent inflation sent U.S. 10-year Treasury yields six basis points higher to 4.71%, pressuring all risk assets. For a market like crypto that thrives on the promise of eventual rate cuts, any data point suggesting the opposite is toxic. The moment illustrated a brutal narrative shift. Traders whispering about Bitcoin's 200-day moving average near $70,000 were suddenly confronted with a chart of rising bond yields.
XRP and Ether Take the Heaviest Hits
While Bitcoin dipped a little over 1% to near $64,000 at the time of reporting, the pain was concentrated elsewhere. Ether was the weakest major, falling over 2% to $1,878. XRP fell almost 2% to $1.01 and was down almost 6% on the week, "the worst of the group by some distance." Their underperformance reveals a market under stress, culling the altcoin herd and showing a tentative flight to perceived quality.
Why these two?
- For XRP, the persistent overhang is its ongoing legal battle with the SEC. Any broader market uncertainty exacerbates its unique regulatory risk.
- For Ether, the recent run-up ahead of its own spot ETF launches has likely created a pool of ready profit-takers. Alex Kuptsikevich, chief market analyst at FxPro, noted the price action shows an absence of aggressive selling into Bitcoin's test of $65,000, which he interprets as "a build-up of short positions well above this level." This suggests sophisticated traders are betting against a quick breakout, a sentiment that spills over to the rest of the sector. It stands in stark contrast to the recent inflows we covered in our analysis of Bitcoin whale accumulation.
A Quick Comparison of Major Tokens on August 11
| Token | Price | 24-Hour Change | 7-Day Change | Performance Context |
|---|---|---|---|---|
| Bitcoin (BTC) | ~$64,000 | -1%+ | Slightly higher | Repeatedly tests and fails at $65,000 resistance. |
| Ether (ETH) | $1,878 | -2%+ | Slightly higher | Weakest major; post-ETF approval profit-taking pressure. |
| XRP | $1.01 | -2% | -6% | Biggest weekly loser; regulatory overhang amplified. |
| Solana (SOL) | $76 | < -1% | +3% | Weekly leader, showing relative strength. |
| BNB | $600 | Slip | +2% | Holds a weekly gain amidst broader weakness. |
Traders’ Psyche: The $70,000 Bitcoin Obsession vs. Inflation Reality
The market is stuck between two powerful, contradictory narratives. On one side is the technical and psychological allure of Bitcoin reclaiming $70,000. Kuptsikevich called it "the next area to watch," noting that clearing it would put Bitcoin above the range that trapped it throughout March and April, "a move that would shift sentiment meaningfully."
On the other side is the cold, hard reality of Wednesday's Consumer Price Index (CPI) report. A hot inflation print would push out expectations for Federal Reserve rate cuts, boosting the U.S. dollar and crushing speculative assets. The fear is so palpable that the crypto sentiment index is stuck at 30, deep in "the fear zone," where it has languished since mid-July. Traders are obsessed with a $70,000 breakout, but their immediate behavior is governed by the inflation threat.
A Brief History of Crypto’s Fragility to Macro Shocks
This isn't new. Cryptocurrency has a long, painful history of sharp pullbacks triggered by CPI prints and Federal Reserve meetings, particularly during the 2022-2023 bear market. What's noteworthy this time is the context. The sell-off is occurring after the landmark approval of spot Bitcoin ETFs and the latest halving, events meant to cement crypto's decoupling from traditional finance.
The early 2026 evidence suggests the opposite. The new ETFs have arguably made the market more correlated to macro forces by funneling in capital from traditional investors who treat Bitcoin as just another risk asset in their portfolio. Their first instinct when bond yields spike is to sell risk, not parse blockchain fundamentals. This episode tests the maturity thesis: a more institutional market is also a more macro-sensitive one, as discussed in our look at a trading firm's $4.75 billion cash cushion built amid Bitcoin doubts.
What This Slide Means for Different Crypto Investors
The market's message varies sharply depending on your strategy.
- For the long-term holder: This is a volatility test, a potential accumulation zone, and largely noise within the four-year cycle thesis. Their focus remains on network fundamentals and the multi-year horizon.
- For the active trader and fund manager: Macro trading has abruptly re-emerged as Job One. Success now requires monitoring economic calendars, Treasury auctions, and oil futures with the same intensity as exchange order books. As Kuptsikevich’s analysis shows, interpreting price action now means reading the "absence of selling" as a build-up of institutional short positions.
- For the altcoin enthusiast: The warning is clear. If Bitcoin, with its $1.3 trillion market cap and institutional backing, is struggling against a jump in bond yields, smaller-cap tokens face exponentially higher risk. The era of easy, market-wide beta gains is paused. Selective strength, like Solana's 3% weekly gain, is the exception that proves the rule.
The Path Through $65,000 and Where Crypto Goes From Here
All roads now lead to Wednesday’s CPI data, released at 8:30 a.m. ET. It serves as the binary gatekeeper for the next major move.
The Bullish Case: A Benign CPI Ignites a Squeeze A CPI number that meets or falls below expectations would immediately relieve the pressure on yields and reignite the "risk-on" trade. The result could be a violent short squeeze, as the build-up of short positions above $65,000 Kuptsikevich identified rapidly unwinds. Capital could flood back into the market, with Bitcoin leading a charge toward $70,000 and dragging a relieved Ether and other majors sharply higher. The $865 million that flowed into U.S. spot Bitcoin ETFs in the five sessions through August 7 shows the capital is waiting on the sidelines for a signal.
The Bearish Case: A Hot CPI Breaks Support A higher-than-expected inflation print would validate the week's fears. It could trigger a wave of selling that breaks key support levels. For Bitcoin, a close decisively below $64,000 could open a path toward $60,000 as leverage is unwound and the market flushes out weaker hands. Ether and XRP would likely see accelerated losses. This scenario would also validate the decision by some funds, as we've reported, to build significant cash positions, treating crypto not as a standalone asset class but as one deeply vulnerable to traditional financial currents.
The strategic takeaway is unambiguous. For the foreseeable future, reading the crypto market requires a dual lens: one eye on on-chain momentum and token-specific developments, and the other locked on the Federal Reserve's next move. The promised land of $70,000 Bitcoin is visible, but the path runs straight through the U.S. Bureau of Labor Statistics.
Disclaimer: This XOOMAR analysis is for informational and educational purposes only. It is not financial, investment, legal, tax, or professional advice. It does not provide buy, sell, hold, price-target, portfolio, or personalized recommendations. Verify information independently and consult qualified professionals before making decisions.
The Bottom Line
- Cryptocurrency's post-ETF euphoria is colliding with macroeconomic reality as inflation fears pressure all risk assets.
- Bitcoin hitting a $65,000 resistance for four consecutive days signals the crypto market is no longer trading in its own bubble but responding to traditional finance indicators.
- The concentrated losses in XRP and Ether indicate deteriorating market sentiment, with weaker cryptocurrencies being culled first as traders potentially seek perceived quality.
Cryptocurrency Performance Comparison
| Asset | Price | 24h Change | Weekly Trend |
|---|---|---|---|
| Bitcoin | $64,000 | -1% | Stalled at $65k resistance |
| Ether | $1,878 | -2% | Weakest major performer |
| XRP | $1.01 | -2% | -6% weekly, worst of group |
Crypto Price Movements
Bitcoin
%-1
Ether
%-2
XRP
%-2
Sources
Disclaimer: Content on XOOMAR is produced using AI-assisted research, drafting, and verification workflows and is intended for informational and educational purposes only. It does not constitute financial, investment, legal, tax, medical, or professional advice of any kind. All analysis reflects available information at the time of publication and may not be current. Verify information independently and consult qualified professionals before making decisions. Editorial policy

Written by
XOOMAR Insights Team
Research and Editorial Desk
The XOOMAR Insights Team pairs automated research with human editorial judgment. We track hundreds of sources across technology, fintech, trading, SaaS, and cybersecurity, cross-check the facts, and explain what happened, why it matters, and what to watch next. We do not just rewrite headlines. Every article is fact-checked and scored for reliability before it goes live, and we link back to the original sources so you can verify anything yourself.
Explore More Topics
Related Articles
 Trading
Bitcoin Defies Oil Spike as Fed and Iran Rattle Markets
Bitcoin held near $64K as oil surged 8% after Iran strikes and the Fed split hawkish, but the calm looks fragile.
Jul 30, 20266 min
 Trading
Bitcoin Fed Decision Traps $64K Rally in Rate Crossfire
Bitcoin reclaimed $64,000 before the Fed decision, but the rally is leaning into the risk event rather than celebrating after it.
Jul 29, 20264 min
 Trading
Silver Plunges as Fed Rate Fears Crush Its Inflation Hedge Appeal
Silver is dropping because rising oil prices are stoking inflation fears, leading traders to bet the Federal Reserve will hike rates, which makes non-yielding a
Aug 11, 20265 min
 Trading
Bitcoin Climbs Above $65K Despite Senate Regulatory Stall
Bitcoin's price held above $65,000 despite the U.S. Senate delaying a key vote on crypto regulations, showing the market had already priced in the delay and is
Aug 10, 20265 min
 Trading
Bitcoin Rally Tied To Trump's Strait Of Hormuz Deal Hopes
Bitcoin surged past $65,000 amid thin crypto news, propelled instead by traders betting a potential Strait of Hormuz reopening deal, hinted by President Trump,
Aug 6, 20267 min
 Fintech
CPI Print Holds Key to Crypto Rally or Ruin
Crypto's fate this week balances on a knife edge, with the July CPI report poised to dictate Fed policy and market risk appetite, while earnings reveal which co
Aug 10, 20266 min
 Technology
Bitcoin's Bizarre Offshoot Stalled for Six Years
A breakaway Bitcoin chain launched to block non-payment data has effectively died, producing only two blocks while the primary network raced ahead by over 300,
Aug 11, 20266 min
 Fintech
Bitcoin Whales Quietly Hoard $1.5 Billion Amid Retail Panic
Bitcoin's largest holders are buying while small investors panic sell, accumulating $1.5 billion in BTC as wallets holding 10,000+ coins hit a six-month high.
Aug 11, 20264 min
 Cybersecurity
Cyber Attackers Destroy Backups Before Demanding Ransom
Modern ransomware attacks deliberately destroy backup data first, forcing companies to shift from passive data copies to provable, automated recovery in hours,
Aug 11, 20266 min
 Fintech
FedNow, RTP Connectors Launch Cross-Border Payments Race
U.S. payments rails FedNow and RTP are changing their rules to win the critical 'last mile' of cross-border transfers, which accounts for 80 percent of a transa
Aug 11, 20267 min
Don't miss the signal
Get our weekly roundup of the stories that matter across tech, fintech, and trading. No noise, just signal.
Free forever. No spam. Unsubscribe anytime.