
Silver ripped through a key technical level on Thursday, notching a nearly 3% gain and shaking off a weeks-long consolidation.
TradingAugust 7, 2026· 3 min read· By XOOMAR Insights Team
Silver Smashes 50-Day SMA, Targets $65 Run
Updated on August 7, 2026
XOOMAR Intelligence
Analyst Take
59/ 100
2 sources analyzedLow confidenceTrend20Freshness93Source Trust84Factual Grounding96Signal Cluster20
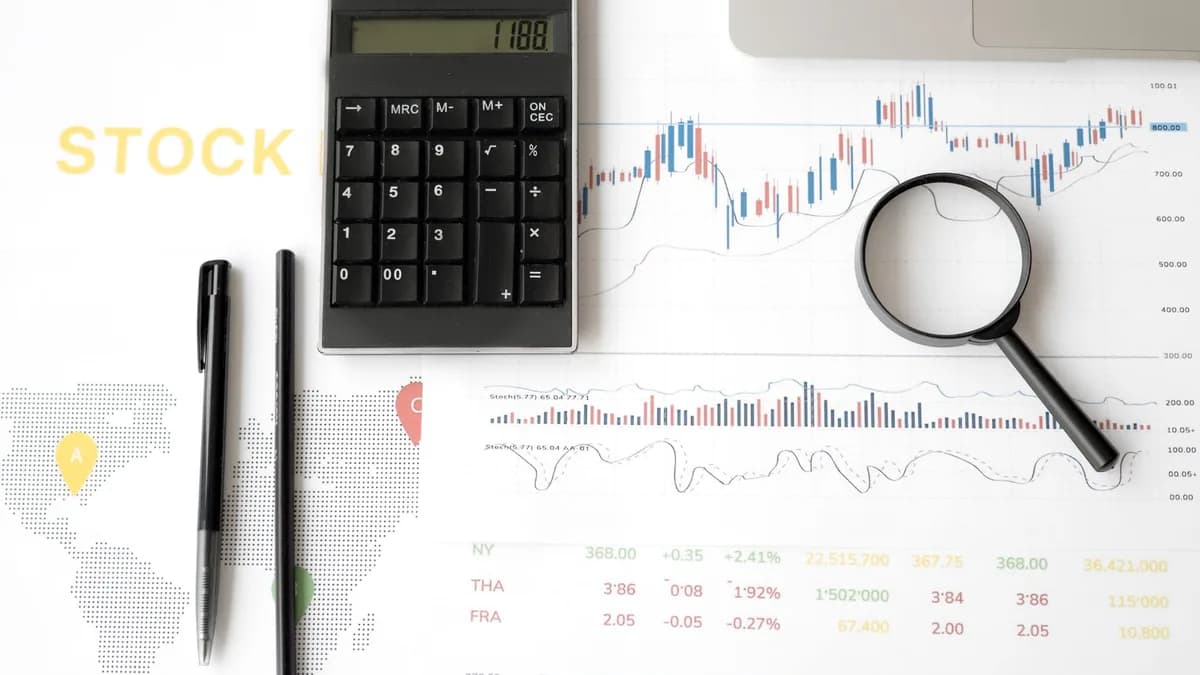
The XAG/USD spot price jumped, clearing the critical 50-day Simple Moving Average at $62.13 before reclaiming the $63.00 handle, according to FXStreet. The surge, also confirmed by real-time spot price charts pegging silver at $63.47, runs headlong into a major barrier: the July 6 high of $63.28. This breakout marks the most significant technical move for the white metal since its recent rally collapsed against a resurgent dollar.
The Bullish Signal Behind the Smashed SMA
Why is clearing a single line on a chart such a big deal? For systematic traders and technical analysts, the 50-day SMA acts as a benchmark for intermediate-term momentum. Trading consistently above it signals a shift from a neutral or bearish bias into a bullish trend. Today’s decisive break suggests fresh institutional money or algorithm-driven buying entered the market.
The technical indicators now align with that bullish momentum. The Relative Strength Index (RSI), a momentum oscillator, has crossed above its neutral 50 level and is now "poised to hit the overbought 70 level, rather sooner than later," per the FXStreet analysis. This move typically indicates strong upward price pressure and can precede extended rallies.
XOOMAR Analysis: While the report doesn't cite a specific fundamental catalyst, the timing is notable. The rally comes ahead of key U.S. inflation data and amid a slight dip in the U.S. Dollar Index. Silver often gains on a softer dollar, as it makes dollar-priced commodities cheaper for foreign buyers. This technical breakout may be the first sign of markets repositioning for a macro regime shift.
A Clear Path to $65, But Only If One Level Breaks
The immediate battle is at $63.28. If bullish momentum can overcome that July high, the next target is clearly defined.
"Silver could test higher prices, once it crosses the $65.00 mark," states the report.
A breach of $65 would open a path to much higher technical ceilings:
- $68.98: The 100-day Simple Moving Average.
- $70.00: A major psychological level.
- $71.22: The 200-day SMA, representing the long-term trend.
However, this rally is fragile. The support structure beneath it is thin. A failure at $63.28 and a drop back below $63.00 could trigger a swift retracement toward the newly conquered 50-day SMA at $62.13. Further weakness targets:
- $60.00: A key round-number support.
- $56.57: The August 3 low, which would erase the entire bullish structure.
This high-stakes setup is reminiscent of recent failed breakouts, as seen when silver bulls last failed to smash through the $63.30 resistance.
Watch Closely Tomorrow for Proof of a Real Bull Run
Friday’s price action is critical. The conflict is now between a freshly triggered technical buy signal and a formidable wall of overhead resistance. Traders will watch for one of two scenarios:
- A sustained break above $63.28 on high volume. This would confirm the breakout's strength and set the stage for a run toward $65. The bullish case would be reinforced if the rally happens alongside a weakening dollar or rising industrial metal complex.
- A rejection at resistance and a close back below $63.00. This would label today’s surge a "false breakout" or bull trap, likely prompting a sell-off toward the $60 support zone.
For now, the bulls have seized the initiative. But the fight for control of silver’s next major trend is just beginning, and the result hinges on a fraction of a dollar.
Disclaimer: This XOOMAR analysis is for informational and educational purposes only. It is not financial, investment, legal, tax, or professional advice. It does not provide buy, sell, hold, price-target, portfolio, or personalized recommendations. Verify information independently and consult qualified professionals before making decisions.
The Bottom Line
- A decisive break above the 50-day SMA signals a potential shift from a neutral/bearish trend to a bullish intermediate-term momentum for silver.
- The rally, coming ahead of key U.S. inflation data and a softer dollar, suggests markets may be repositioning for a macro regime shift that could impact commodity prices broadly.
- For investors and traders, this technical breakout provides a clear short-term price target ($65) and highlights increased buying pressure, as indicated by the RISK crossing above the neutral level.
Silver (XAG/USD) Price Move vs. Key Levels
Previous Settlement
$62.13
50-day SMA
$62.13
Current Spot
$63.47
July 6 High
$63.28
Next Target
$65
Disclaimer: Content on XOOMAR is produced using AI-assisted research, drafting, and verification workflows and is intended for informational and educational purposes only. It does not constitute financial, investment, legal, tax, medical, or professional advice of any kind. All analysis reflects available information at the time of publication and may not be current. Verify information independently and consult qualified professionals before making decisions. Editorial policy

Written by
XOOMAR Insights Team
Research and Editorial Desk
The XOOMAR Insights Team pairs automated research with human editorial judgment. We track hundreds of sources across technology, fintech, trading, SaaS, and cybersecurity, cross-check the facts, and explain what happened, why it matters, and what to watch next. We do not just rewrite headlines. Every article is fact-checked and scored for reliability before it goes live, and we link back to the original sources so you can verify anything yourself.
Explore More Topics
Related Articles
 Trading
Silver Smashes $60 Wall With Biggest Technical Rally in a Month
Silver prices surged past the critical $60 resistance level, hitting a one-month high in a technical breakout fueled by shifting Fed expectations and dollar wea
Aug 5, 20265 min
 Trading
$60 Rejection Traps Silver Price Forecast at 20-Day EMA
Silver’s rebound is stalling below $60 and the 20-day EMA. Bulls need a close above $59.68 to flip pressure back on bears.
Jul 27, 20268 min
 Trading
Silver Bulls Fail to Smash Through Key $63.30 Resistance
Silver's powerful rally is testing a critical $63.30 resistance level, but analysts warn the surge lacks a decisive breakout signature and remains vulnerable to
Aug 7, 20266 min
 Trading
Silver Price Forecast Dares Fed to Test $58 Rebound
Silver reclaimed $58 as the dollar softened, but the Fed and $60.60 resistance will decide whether the rebound has teeth.
Jul 29, 20267 min
 Trading
Yields Crush Silver Price Forecast After $58.65 Rejection
Silver’s $58.65 breakout failed fast as Treasury yields and a stronger dollar pushed XAG/USD lower.
Jul 30, 20268 min
 Fintech
RBI Core Inflation Trap Smothers India Policy Victory
India's core inflation has finally dropped below the RBI's 4% target, but the central bank's hands are tied by a stubborn trade deficit and volatile global oil
Aug 7, 20267 min
 Fintech
Fiserv Core Banking Revenue Plunges 10% in Crisis
Fiserv's core banking software revenue fell 10%, causing a sweeping product review and a 21% drop in earnings, signaling a structural crisis for the dominant pr
Aug 7, 20266 min
 Technology
Roku Floods FAST With AI Slop
Roku is airing a 24/7 channel of AI-generated videos, a stark move that uses ultra-cheap synthetic content to fill ad slots and potentially rewrite the economic
Aug 7, 20269 min
 Global Trends
Chainsaw Ignites California Wildfire, Kills Dog Breeder
A man was arrested after authorities said his chainsaw sparked a catastrophic Sierra Nevada wildfire that killed a dog breeder and burned over 15 square miles.
Aug 7, 20264 min
 Trading
Secret US-Japan Deal Propels Korean Won to Top Asian Currency
The Korean won has become Asia's best-performing currency, fueled by coordinated market intervention and booming tech exports that are challenging the Fed's dol
Aug 7, 20268 min
Don't miss the signal
Get our weekly roundup of the stories that matter across tech, fintech, and trading. No noise, just signal.
Free forever. No spam. Unsubscribe anytime.