
according to FXStreet, the USD/JPY pair is flat, capped below the 50% Fibonacci retracement of July’s sell-off, at the 159.50 area. This isn't just a pause. It's a fundamental market statement: traders are refusing to price in further Fed hawkishness, even as the Bank of Japan stands pat. The question isn't whether the dollar will rally, but why it can't break a simple technical level despite one of the world's most compelling yield gaps.
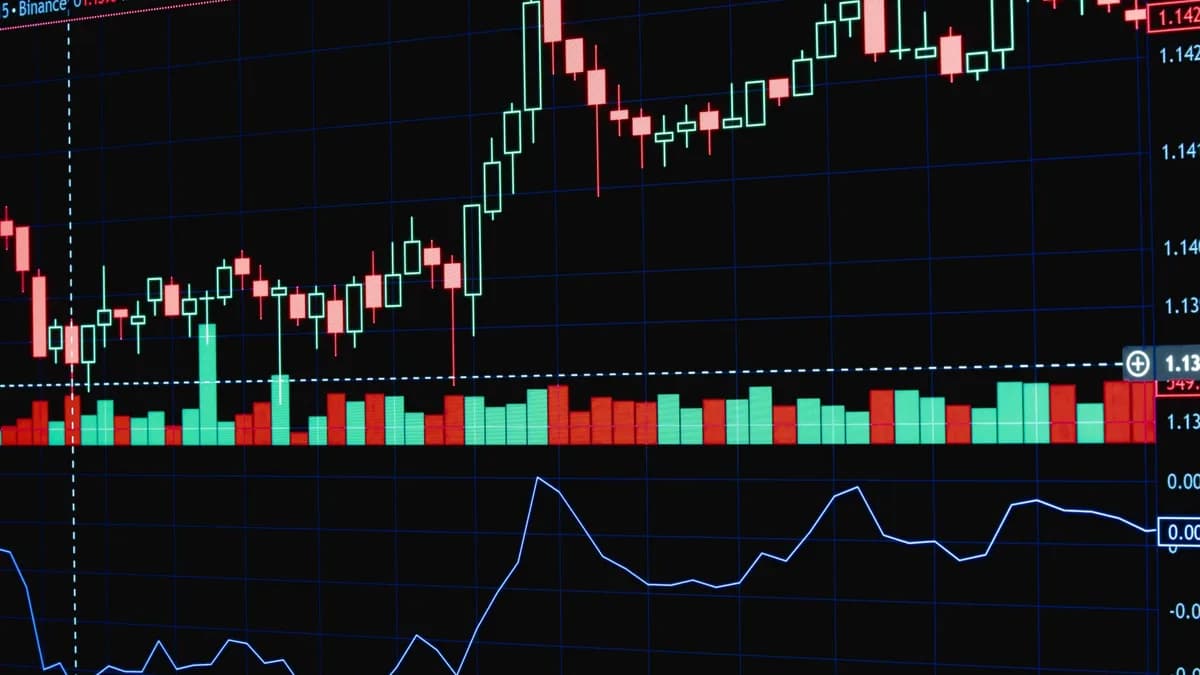
TradingAugust 16, 2026· 5 min read· By XOOMAR Insights Team
Dollar Yield Advantage Fails to Crack Key Yen Line
Updated on August 16, 2026
XOOMAR Intelligence
Analyst Take
65/ 100
2 sources analyzedLow confidenceTrend10Freshness99Source Trust84Factual Grounding78Signal Cluster60
Why Is a Fibonacci Level Halting the World's Favorite Carry Trade?
The 159.50 level isn't arbitrary. It is the precise midpoint of the currency pair's sharp July decline. In technical terms, retracing half of a major move is a classic inflection point, a test of whether the prior trend's momentum is truly dead or just resting.
The USD/JPY pair maintains its near-term upside trend intact, yet with bulls capped below the 50% Fibonacci retracement of July’s sell-off.
For now, the ceiling is holding. The analysts note the path toward 160.00, a psychological line in the sand for Tokyo authorities, and the July 31 highs near 160.90 remain closed. The failure to power through here, despite a still-bulldozer yield differential, signals a profound lack of speculative conviction in the dollar's next leg up.
What Does 'Fading Momentum' Look Like on the Charts?
The source material offers a clear snapshot of waning bullish energy. The 4-hour Relative Strength Index (14) reads a neutral-constructive 57.22, but the Moving Average Convergence Divergence (MACD) indicator is flattening near the zero line. This divergence is critical: price action may be stable or creeping higher, but the underlying buying pressure is evaporating.
On the downside, the immediate floor is the 38.2% Fibonacci retracement at 158.53. A break below that opens a test of the August 4 and 5 lows near 157.30, which aligns with the 23.6% retracement at 157.28. The market has built a tight technical box: 158.53 to 159.50. A breakout from this range will signal which force, Fed doubt or BOJ weakness, has gained the upper hand.
Has the Fed's Hawkish Narrative Already Peaked?
The immediate driver of the stall is a shift in U.S. rate expectations. The FXStreet report is explicit: "fading hopes of a Federal Reserve (Fed) interest rate hike in September have undermined speculative demand for the Greenback." This isn't about long-term policy, but the removal of the next incremental hike from the pricing matrix.
Analysts at TD Securities frame it succinctly: "near-term inflation risks still skew higher, but Fed can be patient." More telling is their observation on currency flows: "USD traded weaker as in-line CPI release still preserved bearish USD momentum." An in-line inflation print should be neutral, but it instead fueled a broader dollar slump that powered an Aussie rally. The fact it fueled dollar selling reveals a market positioned for hawkish surprises that didn't arrive. The door for further tightening isn't slammed shut, but the urgency has vanished.
XOOMAR Interpretation: This has created a "higher-for-longer, but not higher-still" dollar environment. The core yield support remains, but the marginal buyer who bets on the next hike has stepped away. This aligns with our previous reporting in Cooling Inflation Crushes Dollar as Fed Hike Bets Vanish, which detailed how softer data began eroding the dollar's primary catalyst.
Is the 160 'Line in the Sand' More Powerful Than Yield Math?
Here lies the unique tension in USD/JPY. While Fed bets fade, the Bank of Japan has not meaningfully altered its ultra-accommodative core stance. The yen's fundamental weakness remains. Yet, the pair cannot rally.
The source directly references 160.00 as "a line in the sand for Tokyo authorities." The market is trading not just economics, but perceived political and intervention risk. Every approach to 160 triggers memories of the late-July plunge and unconfirmed Ministry of Finance actions. The threat is enough to cap rallies, creating an invisible ceiling that overshadows even attractive yield differentials. It's a "MoF put" that currently trumps the decaying "Fed call."
Who Is Still Buying, and Who Has Backed Away?
This stalemate creates a fractured market landscape.
- Leveraged Funds (Hedge Funds): Likely reducing net-long USD/JPY positions, as the fading Fed catalyst and intervention risk degrade the trade's risk/reward.
- Japanese Corporations: In a holding pattern. Exporters might see a gift near 159 for hedging, while importers face a painful wait for relief.
- Retail Carry Traders: The persistent yield gap keeps this group engaged, but they are sensitive to volatility spikes. Their presence provides a baseline of support but not explosive upside.
The flattening MACD and capped price action suggest the dominant market force, speculative momentum buyers, is stepping back. The trade is becoming a grind, not a sprint.
How Does This Range Break?
The pair is waiting for a decisive catalyst to resolve the battle between yield support and policy headwinds. The path forward depends on which narrative cracks first.
Break Above 159.50 / 160.00 Scenario: This requires a rekindling of U.S. inflation fears strong enough to revive September hike bets, or a clear signal from the BOJ that it will tolerate a significantly weaker yen. A clean breach of 160.90 (the July high) would likely trigger a rush of algorithmic and momentum buying, targeting new cycle highs.
Break Below 158.53 / 157.30 Scenario: This would be fueled by a continued unwind of Fed expectations, perhaps triggered by softer U.S. activity data. A slide could accelerate if it forces carry-trade unwinds and breaks the perception of the 157-158 area as stable support. The next major target would be the 155.00 psychological zone.
For now, the market is parked. The price action screams that without a fresh jolt from U.S. data or a decisive move from Japanese authorities, USD/JPY is stuck in a technician's purgatory. The trade is no longer about discovering a new trend, but about betting on which side of the range will finally break under pressure.
Disclaimer: This XOOMAR analysis is for informational and educational purposes only. It is not financial, investment, legal, tax, or professional advice. It does not provide buy, sell, hold, price-target, portfolio, or personalized recommendations. Verify information independently and consult qualified professionals before making decisions.
The Bottom Line
- The pair's failure to break the 159.50 Fibonacci level signals traders lack conviction in further Federal Reserve hawkishness, despite a massive yield gap.
- A break below the 158.53 support could accelerate a sell-off, exposing the August lows near 157.50 and jeopardizing the carry trade's momentum.
- With Tokyo authorities vigilant near 160.00, any failed breakout risks triggering official intervention, adding volatility and uncertainty for forex positions.
USD/JPY Key Technical Levels
Current Price (capped)
JPY159.5
38.2% Fib Support
JPY158.53
50% Fib Resistance
JPY159.5
Psychological Resistance
JPY160
July High
JPY160.9
Sources
Disclaimer: Content on XOOMAR is produced using AI-assisted research, drafting, and verification workflows and is intended for informational and educational purposes only. It does not constitute financial, investment, legal, tax, medical, or professional advice of any kind. All analysis reflects available information at the time of publication and may not be current. Verify information independently and consult qualified professionals before making decisions. Editorial policy

Written by
XOOMAR Insights Team
Research and Editorial Desk
The XOOMAR Insights Team pairs automated research with human editorial judgment. We track hundreds of sources across technology, fintech, trading, SaaS, and cybersecurity, cross-check the facts, and explain what happened, why it matters, and what to watch next. We do not just rewrite headlines. Every article is fact-checked and scored for reliability before it goes live, and we link back to the original sources so you can verify anything yourself.
Explore More Topics
Related Articles
 Trading
Tokyo's Yen Gambit Already Fails at $153 Ceiling
TD Securities strategists assert Japan's massive currency intervention only created a temporary bounce, with USD/JPY's decline capped near 153 as overwhelming U
Aug 9, 20266 min
 Trading
Japan's Financial Shield Shatters as Yen Crashes 0.6%
Japan unexpectedly posted a current account deficit for the first time in 17 months, sending the yen tumbling as traders question the country's long-term econom
Aug 15, 20266 min
 Trading
Yen Slump Erases Half of Joint Japan-US Intervention Gains
The Japanese yen fell to a fresh two-week low, erasing over half the gains from last month's historic U.S.-Japan joint FX intervention as global dollar strength
Aug 12, 20265 min
 Trading
Loonie Soars on Its Own Merits, Defies Dollar Dominance
The Canadian dollar staged a defiant rally that began before dismal US retail sales data, signaling a potential market re-rating as the Loonie starts to trade o
Aug 15, 20269 min
 Trading
Swiss Franc Rallies as US Inflation Miss Unsettles Dollar
A soft U.S. inflation report shattered the dollar's momentum, sending traders fleeing into the Swiss franc as expectations for Federal Reserve tightening collap
Aug 14, 20266 min
 Global Trends
Crown Prince’s Protest Exposes Imperial Monarchy Rift
Japan’s Crown Prince Akishino broke royal protocol by publicly opposing the government’s new male-only succession law, exposing a deep rift within the imperial
Aug 17, 20265 min
 Fintech
MUFG Attacks $1.7 Trillion Bond Market Lag With Blockchain
Mitsubishi UFJ is testing real-time blockchain settlement for Japan's $1.7 trillion government bond repo market, aiming to collapse a process that takes days in
Aug 16, 20265 min
 Global Trends
Japan Aims to Seal $10 Billion Australian Frigate Deal
Japanese and Australian defense ministers are meeting to push forward a critical $10 billion deal for Mogami-class frigates, a strategic move overshadowed by a
Aug 16, 20265 min
 Global Trends
Met Police Chooses Victims Who Matter, Mother Says
Mina Smallman, a mother who lost two daughters to murder and witnessed police corruption, declares the Metropolitan Police incapable of reform after seeing how
Aug 17, 20265 min
 Future Fiction
Stream Hit Point Free Legally From Any Country
You can legally stream the entire 'Hit Point' box set for free from anywhere by accessing UK-based ad-supported platforms, using a simple method to bypass geogr
Aug 17, 20266 min
Don't miss the signal
Get our weekly roundup of the stories that matter across tech, fintech, and trading. No noise, just signal.
Free forever. No spam. Unsubscribe anytime.