
The euro’s rally hit a wall at exactly 1.1567, a price defined by the average of its last 100 days. For now, the math is winning. According to the latest technical analysis from FXStreet, the EUR/USD’s advance of over 0.32% was blocked at the 100-day Simple Moving Average (SMA), halting a move that had bulls eyeing the 1.1600 handle. The pair trades at 1.1564, a mere 3 pips below a line that has become the focal point for this week’s trading.
TradingAugust 14, 2026· 7 min read· By XOOMAR Insights Team
100-Day SMA Halts Euro Rally in FX Power Struggle
Updated on August 14, 2026
XOOMAR Intelligence
Analyst Take
76/ 100
3 sources analyzedLow confidenceTrend10Freshness100Source Trust84Factual Grounding75Signal Cluster100
This is more than a minor rejection. It's a test of whether recent euro strength is a fleeting correction or the start of a genuine trend reversal. The failure to close above the SMA, even as the Relative Strength Index (RSI) suggests building bullish momentum, reveals a market where algorithmic signals and fundamental doubt are locked in a standoff.
The 100-Day SMA Breaks EUR/USD Bulls
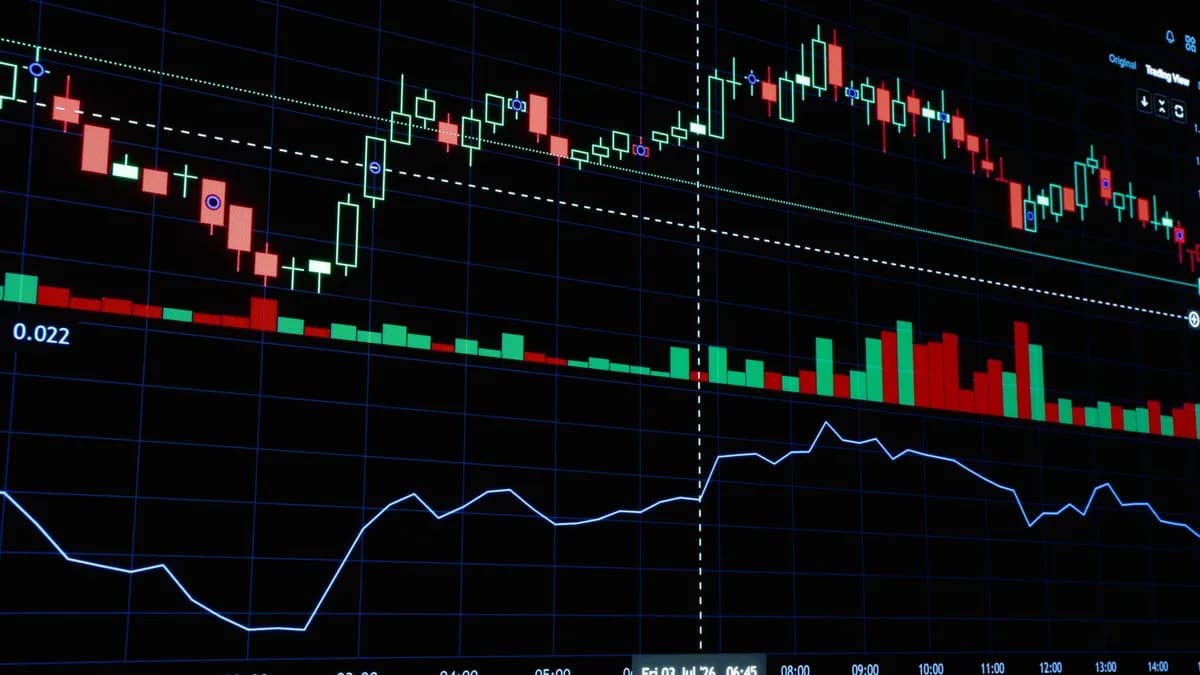
The technical battlefield is starkly simple. The 100-day SMA at 1.1567 provided immediate and effective resistance. The pair bounced from daily lows of 1.1526 to challenge it, but could not sustain a break. This precise interaction is critical. For systematic and institutional traders, specific moving averages like the 100-day SMA are programmed as key decision points for entry, stop-losses, and position sizing. A failure here doesn't just mean a price didn't go up, it triggers a wave of automated selling.
The broader market structure, as noted by FXStreet, remains bearish, defined by "successive lower highs and lower lows." While the reclamation of the 1.1500 area since July 30 increased the risk of a bullish reversal, the ceiling at the 100-day SMA has, for now, contained that optimism. The momentum is present, but the clearance of defined resistance levels remains the necessary proof.
A Technical Firefight at Two Different Levels
Traders are now watching two distinct levels: the institutional 100-day SMA and the psychological 1.1600 figure.
The 100-Day SMA (1.1567): This is the quant's line. Its breach would signal a shift in the medium-term trend to a significant portion of the market's capital. The next confirmed resistance beyond it is the 200-day SMA at 1.1629, followed by the May 29 high at 1.1685. A clean break opens a path toward 1.1700 and beyond.
The 1.1600 Handle: This is the retail and algo-round-number target. Its symbolic importance makes it a magnet for orders, but its breach is less mechanically significant than the SMA break. The current failure at the lower, more technical level suggests the higher psychological level is out of reach for the moment.
The bounce from 1.1526 has created a tight, fragile trading range between that support and the 1.1567 resistance. A break below 1.1526 could quickly target the 50-day SMA at 1.1465.
The Euro's Fundamental Shackles
This technical stall is the chart accurately pricing in a fundamental cage. While the source material focuses on price action, the underlying driver of the persistent downtrend is the transatlantic policy divergence.
- The Fed's Stance: The U.S. central bank remains publicly committed to its tightening path, supporting the dollar's yield advantage. Recent data may have softened Fed rate hike expectations, but the policy bias is still hawkish relative to the ECB.
- The ECB's Dilemma: The European Central Bank faces a stagnating economy alongside high inflation, forcing a more cautious, "lower for longer" approach. Any hawkish signals are quickly tempered by growth concerns.
The 100-day SMA's resistance is, in essence, a technical manifestation of the market's skepticism that the euro can sustainably rally while this policy gap persists. The chart resistance isn't random, it's a collective judgment on the macro outlook.
What FX Traders See from Their Desks This Week
The view differs drastically depending on your screen.
- The Algorithmic Trader's Screen: It shows a clear, rules-based sell signal. Price approached a key moving average (100-day SMA), rejected it, and momentum (while rising) is not yet at overbought levels. The model's next actionable level is a break of the 1.1526 low. For these traders, the story is simple and binary.
- The Macro Hedge Fund Manager's Screen: It's cluttered with economic data feeds and central bank commentary. They see the euro's bounce as a technical correction within a larger dollar-strong regime, fueled by fleeting momentum or short-covering. They are not convinced of a sustainable euro rally without a clear, fundamental catalyst that shifts the policy divergence narrative. They might view this SMA rejection as confirmation of their core dollar-long view.
- The Retail Trader's Screen: It's likely fixated on that 1.1600 level, with a fading hope for a clean breakout. The rejection at 1.1567 is frustrating, forcing a decision: cut the long position or double down and hope for a second-wave breakout. Many lack the institutional tools to parse the difference between the SMA and the round-number resistance.
For those navigating this volatility, having the right analytical tools is critical. Retail traders often lack the institutional-grade analytics that clarify these precise battles, a gap that can be costly. Our guide on the essential analytics retail traders miss details what to look for.
A History of Failed Breaks Above This Moving Average
Market memory is a powerful force. The 100-day SMA has not just been a level today, it has been a cap for months. Each failed test reinforces its authority and teaches the market where to sell.
While the source material doesn't provide a full history, the pattern it describes, "successive lower highs and lower lows", implies this is not the first time a rally has been stifled. Each prior failure led to a retest of lower supports, like the 1.1500 area or the 50-day SMA. This sets a discouraging precedent: bulls who buy the breakout fake-out get punished, making them more hesitant the next time price approaches the SMA. The market's muscle memory is now a tangible headwind. Every trader who has been stopped out at this level remembers it.
What This Means for Your Currency Exposure
The implications extend beyond day-trading p&l.
- For Corporates Hedging FX Risk: This action reinforces that hedging windows for euro exposure are likely to be brief and technical. The failure to launch from a key level suggests this is not the start of a major, trending move higher for EUR/USD. It validates a strategy of executing hedges on rallies toward resistance rather than waiting for a breakout.
- For Cross-Asset Investors: The dollar's resilience here, even amidst shifting Fed expectations, supports the ongoing narrative of dollar strength for global asset allocation. A euro that cannot break key technical levels lacks the conviction to drive a sustained rotation into European assets.
- For Active Traders: The clear, respected range between 1.1526 and 1.1567 (with an extension to 1.1600) means range-bound strategies, selling resistance, buying support, will outperform breakout-following strategies until this ceiling is conclusively shattered. The path of least resistance remains sideways.
For traders and firms looking to act on this environment, access to reliable execution is key. Some are exploring more agile market structures, similar to how new fintech lenders are disrupting their industries, as seen in the rapid scaling of Figure's blockchain loan marketplace.
The Path Ahead: Stagnation or a Shock Breakout
The immediate forecast is for continued churn. Without a major catalyst, the EUR/USD is likely to oscillate between the daily low support near 1.1525 and the 100-day SMA resistance, now at 1.1567.
A decisive move requires a fundamental shock that overrides the technical gridlock:
- Upside Catalyst: A surprisingly hawkish shift from the ECB (e.g., committing to a longer rate-hike cycle) coupled with a soft US inflation print that dramatically unwinds Fed tightening bets. This could power a clean break above the 200-day SMA at 1.1629.
- Downside Catalyst: Reinvigorated US economic data that restores full Fed hike expectations, or a distinctly dovish ECB turn. This could smash through the 1.1500 support and target the 50-day SMA at 1.1465.
XOOMAR Interpretation: The burden of proof remains squarely on the bulls. They have momentum (RSI), but they lack the price confirmation. In FX, price is the final vote. Until buyers can muster the volume to achieve a daily close above the 100-day SMA, the path of least resistance is not up, but sideways with a downward bias. The 100-day SMA isn't just a line on a chart this week, it's the judge of euro credibility.
Disclaimer: This XOOMAR analysis is for informational and educational purposes only. It is not financial, investment, legal, tax, or professional advice. It does not provide buy, sell, hold, price-target, portfolio, or personalized recommendations. Verify information independently and consult qualified professionals before making decisions.
The Bottom Line
- The 100-day SMA at 1.1567 acted as a critical resistance barrier, halting a 0.32% EUR/USD rally and determining the near-term market direction.
- This price action tests whether recent euro strength is a short-lived correction or the beginning of a genuine bullish trend reversal.
- The outcome dictates immediate algorithmic trading decisions, as failure at this level triggers automated selling and impacts major institutional strategies.
Sources
Disclaimer: Content on XOOMAR is produced using AI-assisted research, drafting, and verification workflows and is intended for informational and educational purposes only. It does not constitute financial, investment, legal, tax, medical, or professional advice of any kind. All analysis reflects available information at the time of publication and may not be current. Verify information independently and consult qualified professionals before making decisions. Editorial policy

Written by
XOOMAR Insights Team
Research and Editorial Desk
The XOOMAR Insights Team pairs automated research with human editorial judgment. We track hundreds of sources across technology, fintech, trading, SaaS, and cybersecurity, cross-check the facts, and explain what happened, why it matters, and what to watch next. We do not just rewrite headlines. Every article is fact-checked and scored for reliability before it goes live, and we link back to the original sources so you can verify anything yourself.
Explore More Topics
Related Articles
 Trading
Euro's 100-Pip Trap Tests the Dollar's Dominant Grip
The euro is consolidating in a tight 1.15-1.16 range against the dollar, a move Scotiabank calls a bullish shift that's now testing immediate resistance and the
Aug 9, 20265 min
 Trading
Euro Drops as US-Iran Peace Hopes Fade
The Euro retreated as hopes for a quick US-Iran peace deal vanished, removing a key support. The stalemate is pushing oil prices higher, creating a painful econ
Aug 11, 20267 min
 Trading
Bad Jobs Report Smashes Dollar, Pumps Euro to Two-Month High
A stunningly weak U.S. jobs report crushed the dollar and sparked a flash rally in the euro, as traders rapidly priced out further Federal Reserve rate hikes.
Aug 10, 20266 min
 Trading
2026's Fastest ECN Brokers Cut Spreads to Zero Pips
For active traders, the fastest ECN brokers in 2026 are competing on execution speeds under 40 milliseconds and raw spreads on major currency pairs.
Aug 13, 202613 min
 Trading
Pound's Quiet Battle Tests Fear Barrier as Hedges Fade
Sterling's grind toward 1.36 is being driven by fading fear, not headlines, as institutional hedging pressure eases, allowing the currency to test a key technic
Aug 12, 20265 min
 Fintech
Australian Dollar Freezes at 0.7060 Ahead of RBA Verdict
The Australian Dollar has halted its rally, stuck at 0.7060 as traders freeze ahead of the RBA's critical rate decision and guidance.
Aug 14, 20266 min
 Fintech
Australian Dollar Awaits Bullock After U.S. Inflation Fizzle
The Australian Dollar is barely moving on its own economic news, drifting instead on U.S. inflation data and leaving the RBA struggling to control the narrative
Aug 13, 20267 min
 Fintech
RBA Unanimity Signals Australian Dollar Pressure
The RBA's unanimous rate hold and downgraded economic forecasts signal a clear easing bias, setting the Australian Dollar on a path of sustained pressure.
Aug 13, 20265 min
 Fintech
Your Retirement Account Could Pay Out to an Ex
Overlooking a simple beneficiary form can legally unravel your entire estate plan, directing your assets to an ex or unintended heir instead of your family.
Aug 14, 20267 min
 Fintech
SBA Loan Spree Derails Florida Bank With $33M Loss
BayFirst Financial's $32.7 million quarterly loss marks the final, brutal cost of its disastrous high-volume SBA loan program, forcing a complete strategic retr
Aug 14, 20266 min
Don't miss the signal
Get our weekly roundup of the stories that matter across tech, fintech, and trading. No noise, just signal.
Free forever. No spam. Unsubscribe anytime.