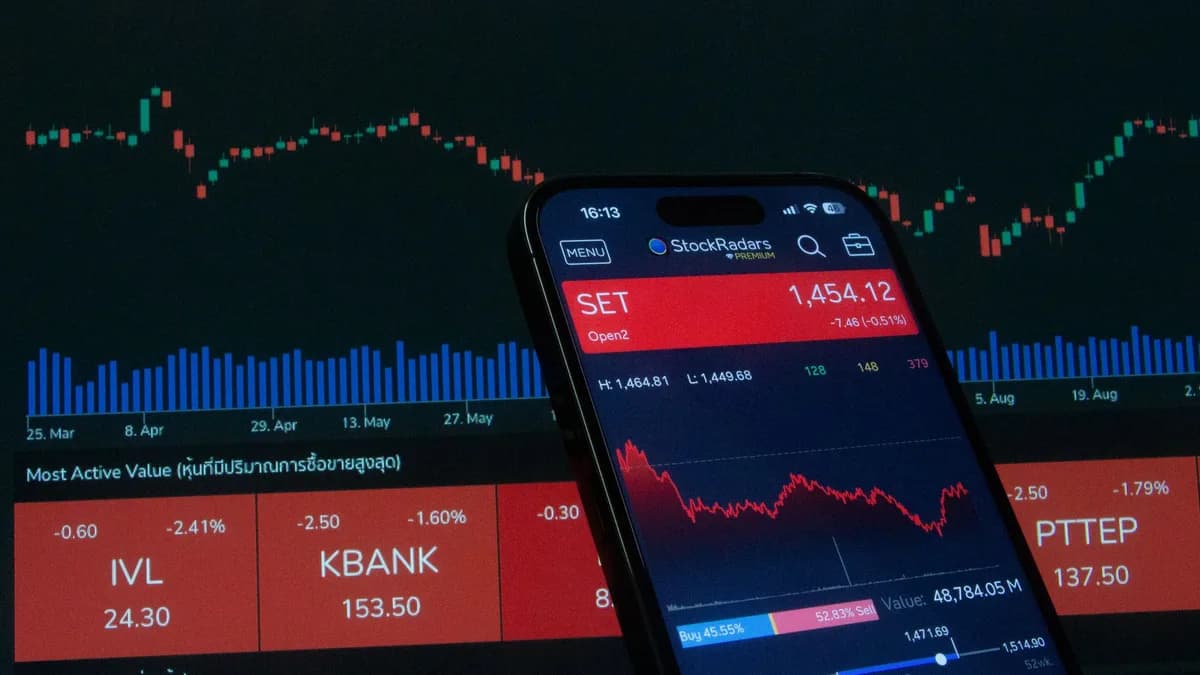
For the discretionary trader with a promising market idea, the leap from concept to confident execution often feels daunting. The prevailing wisdom suggests you must learn to code to properly test your strategy, creating a significant barrier to entry. Yet, in 2026, this is no longer the case. Learning how to backtest trading strategies without coding is not only possible but accessible through powerful, visual platforms that turn historical data into a risk-free proving ground. This guide will walk you through the essential tools and methodologies, grounded in real software and data, to validate your ideas and build statistical confidence before ever placing a live trade.
Why Backtesting Matters (Even for Non-Programmers)
Backtesting is the process of applying your trading rules to historical market data to see how they would have performed. Think of it as a time machine for your strategy, a simulator that reveals its statistical edge, weaknesses, and behavioral characteristics using the cold, hard facts of past price action.
Backtesting isn't optional. It's the difference between gambling and trading with a genuine edge.
The core benefit is risk-free validation. As one source puts it, backtesting "costs you nothing except time, but it can save you thousands in real losses." It transforms vague hope into quantifiable expectation. You’ll move from thinking your strategy might work to knowing its historical win rate, average profit vs. loss, and most painful drawdown periods. This knowledge builds psychological resilience; when a losing streak occurs live, you won't abandon a valid system because you've already seen it recover in your tests.
It’s crucial to distinguish backtesting from other forms of testing. Paper trading or forward testing involves applying your strategy in real-time with simulated money. While essential for understanding execution nuances, it is slower. The recommended progression is clear: backtest first to validate the core edge exists in historical data, then forward test to bridge the gap between theory and real-time practice.
Understanding the Limits of No-Code Backtesting
While modern tools are powerful, they come with inherent constraints you must acknowledge to avoid misleading results.
First, automation has boundaries. No-code builders excel at testing rules-based strategies with clear technical indicators (e.g., "RSI crosses above 30"). They struggle with strategies requiring significant discretionary judgment, nuanced price action reading, or multi-timeframe analysis that isn't easily defined by a dropdown menu. For these, manual walk-through methods are more appropriate.
Second, there is a pervasive risk of curve-fitting or over-optimization. The ease of clicking to adjust parameters can lead you to engineer a strategy that performs flawlessly on past data but fails on new, unseen data. As research warns, "If you tweak enough parameters, you can engineer perfect historical performance, that fails completely on future data."
Other critical pitfalls include:
- Ignoring Real Costs: A strategy showing a 18% return before costs might only deliver 3% after accounting for realistic commissions and slippage.
- Insufficient Sample Size: A backtest with only 15-20 trades is statistically meaningless. Aim for at least 100 trades to generate reliable metrics.
- Survivorship Bias: Testing only on current, successful stocks ignores those that were delisted or went bankrupt, artificially inflating the results of long-only strategies.
- Look-Ahead Bias: Accidentally using future data in your test, such as by seeing how a trade played out before deciding to take it. Combat this by hiding future price action during manual testing.
TradingView's Strategy Tester: Visual Rule Builder and Pine Script
TradingView is frequently rated as a top choice for its balance of accessibility and depth. Its Strategy Tester is a browser-based tool that provides a fast path to automated backtesting results.
The platform hosts a massive library of pre-built strategies, like RSI-based, moving average crossovers, or Bollinger Band breakouts, which you can apply to any chart with a click. Opening the Strategy Tester panel reveals performance summaries, detailed metrics, and a list of every simulated trade. You can instantly adjust parameters (like moving average periods or stop-loss percentages) via a settings gear icon and see the results update in real time.
For those wanting more customization without full-scale programming, TradingView offers Pine Script, a domain-specific language. While it involves writing code, its syntax is designed for trading logic, and the community provides countless scripts to learn from and modify. However, the core no-code functionality resides in applying and tweaking these pre-built strategies.
Key Details (from source data):
- Cost: Free tier available; the Essential plan for more data starts at $14.95/month.
- Data Limits (Free Tier): Up to 10,000 bars on daily/weekly charts, but only about 1,500 bars for intraday timeframes (roughly 3-6 months of data).
- Best For: Stocks, forex, and crypto traders seeking quick, automated testing with a vast indicator library.
TrendSpider's Automated Strategy Tester
Note: While "TrendSpider" is mentioned in the provided outline, the name does not appear in the supplied source data. Therefore, to adhere strictly to the sources, this section cannot be elaborated upon with specific features or benchmarks. At the time of writing, traders researching automated strategy testers would need to consult platforms explicitly covered in the available research.
Trade Ideas with the Odds Maker Scanner
Trade Ideas is highlighted in the sources as a premium platform that integrates real-time scanning with backtesting functionality through its Odds Maker feature. This tool allows you to build, test, and automate strategies based on a vast array of technical, fundamental, and social filters.
An exclusive offer noted in the research provides a sense of its positioning: the code NANO2026 takes 15% off any plan, reducing the Premium Annual subscription from $2,136 to $1,815.60. The platform’s advertised strengths include real-time scanning across 500+ filters, Holly AI signals that are nightly backtested, and the integrated OddsMaker backtesting suite with brokerage execution.
This positions Trade Ideas as a comprehensive toolkit for active stock traders who want to move seamlessly from hypothesis (backtest) to scan (identify live signals) to execution, all within a single ecosystem.
Using Thinkorswim's OnDemand Feature for Historical Walkthroughs
Thinkorswim by Schwab offers a uniquely hands-on approach through its OnDemand feature, which is free with a brokerage account. Instead of fully automated backtesting, OnDemand lets you replay historical market data in real time.
You select a past start date, and the platform loads charts and data exactly as they appeared on that day. You can then fast-forward through time, place simulated paper trades based on your strategy, and experience the market's flow as it happened. This method is exceptionally valuable for discretionary strategies that involve judgment, multi-timeframe analysis, or reading order flow, elements difficult to codify in an automated test.
Key Details (from source data):
- Cost: Free with a Schwab account.
- Method: Manual replay/walk-forward simulation.
- Best For: Options traders and discretionary traders who need to test judgment calls in a realistic, historical context.
- Rating: One comparative review rated it 4.7/5.
Step-by-Step: Backtesting a Simple Moving Average Crossover Strategy
Let’s apply the theory using TradingView's no-code tools, as detailed in the sources. We'll test a classic strategy: Buy when a short-term moving average crosses above a long-term one, and sell on the opposite crossover.
- Open a Chart: On TradingView, open a chart for your chosen asset (e.g., SPY).
- Open Indicators & Strategies: Click the "Indicators" button, then navigate to the "Strategies" tab.
- Find and Apply a Strategy: Search for "Moving Average Crossover" or a similar pre-built strategy. Click to apply it to your chart. Buy/sell arrows will appear.
- Open the Strategy Tester: Click the "Strategy Tester" tab at the bottom of your screen.
- Review Initial Results: The "Overview" tab shows key stats: Net Profit %, Total Trades, Win Rate, etc.
- Adjust Parameters: Click the gear icon on the strategy label. A settings pane opens. Change the short and long moving average periods (e.g., from 50/200 to 20/50). The backtest results update immediately.
- Analyze the List of Trades: Switch to the "List of Trades" tab to inspect every individual entry and exit, including the equity curve.
This process can be completed in minutes, providing instant feedback on how a basic rule set has performed historically.
Analyzing the Results: Win Rate, Profit Factor, and Max Drawdown
Generating a backtest is only the first step. Correctly interpreting the metrics is what separates robust analysis from self-deception. Here are the non-negotiable metrics, as emphasized across sources:
| Metric | What It Tells You | What to Look For |
|---|---|---|
| Win Rate | Percentage of trades that were profitable. | Don't obsess. A 45% win rate can be highly profitable if winners are much larger than losers. |
| Profit Factor | (Gross Profit / Gross Loss). The most critical metric. | A value above 1.0 means the strategy is profitable. Aim for 1.5 or higher. Research notes: "A 60% win rate with a 1.2 profit factor is actually worse than a 45% win rate with a 2.0." |
| Max Drawdown | Largest peak-to-trough decline in your equity curve. | Measures your worst historical pain. Can you psychologically and financially withstand this drawdown? |
| Average R Multiple | Average profit/loss per trade, normalized by risk (R). | Helps standardize trade size. An average above 0.0 is profitable. |
| Total Number of Trades | Sample size for your statistical analysis. | Aim for at least 100 trades. Fewer than 30-50 trades makes the results statistically unreliable. |
Always input realistic trading costs (commission, slippage) if the platform allows it. A strategy that looks great "on paper" can be unprofitable in the real world after costs.
Common Pitfalls in No-Code Backtesting and How to Avoid Them
Even with the best tools, the trader is the final safeguard against flawed conclusions.
Pitfall 1: Over-Optimizing for the Past (Curve-Fitting).
- How to Avoid: Use the "one to test, one to validate" method. Run your initial backtest on a specific historical period (e.g., 2018-2021). Then, without changing any parameters, run it on a completely different, out-of-sample period (e.g., 2022-2024). If performance holds up reasonably well, it's more robust.
Pitfall 2: Testing in Only One Market Regime.
- How to Avoid: Ensure your backtest covers a full market cycle, include bull, bear, and sideways periods. Testing a momentum strategy only on 2020-2021 bull market data tells you little about its durability.
Pitfall 3: Vague Strategy Rules.
- How to Avoid: Before you even open a backtesting platform, your strategy must answer specific questions, as one source outlines:
- What is the exact setup?
- What is the precise entry trigger?
- Where is the stop loss?
- How do you exit winners?
- What is the position size?
- What is the timeframe?
- Which markets/instruments qualify?
- How to Avoid: Before you even open a backtesting platform, your strategy must answer specific questions, as one source outlines:
Pitfall 4: Ignoring Slippage and Commissions.
- How to Avoid: Always enable and configure the cost assumptions in your backtesting software. Use conservative estimates for your broker and asset class.
When to Upgrade to a Custom-Coded Solution
No-code platforms will take most traders very far. However, there are clear signals that you might need the flexibility of a coded solution:
- Your Strategy Logic is Highly Complex: Involves conditional relationships, multi-asset correlations, or proprietary calculations not found in standard platforms.
- You Need to Test on Extremely Long Timeframes or Massive Datasets: Beyond what commercial platforms offer in their standard plans.
- You Require Custom Performance Metrics or Analysis: Beyond standard win rate, profit factor, and drawdown.
- You Aim for Fully Automated, High-Frequency Execution: The latency and integration needs may demand a custom-built system.
The transition often starts with learning a trading-focused language like Pine Script (TradingView) or thinkScript (Thinkorswim), which are designed to be more accessible than general-purpose programming languages.
FAQ
What is the best free platform to backtest trading strategies without coding? Based on comparative reviews, TradingView is highly rated (4.8/5) for its automated Strategy Tester and vast pre-built strategy library. Thinkorswim's OnDemand (free with a Schwab account) is exceptional for manual, walk-forward testing, especially for discretionary and options strategies.
How many trades do I need in a backtest for it to be reliable? Sources consistently emphasize the need for a statistically significant sample size. Aim for at least 100 trades. A backtest with only 15-20 trades is considered "statistically meaningless" for drawing firm conclusions about a strategy's edge.
What is more important: a high win rate or a high profit factor? Profit factor is the more critical metric. It measures the ratio of gross profit to gross loss. A strategy with a 45% win rate but a profit factor of 2.0 is more profitable than one with a 60% win rate and a 1.2 profit factor. Always prioritize profit factor.
Can I trust a backtest that shows great results? Not blindly. You must audit the test for common pitfalls like over-optimization, ignoring trading costs, survivorship bias, and a small sample size. The most trustworthy results come from a strategy tested on out-of-sample data with realistic costs applied.
What's the difference between backtesting and paper trading? Backtesting applies rules to historical data to see how they would have performed. It's fast and analytical. Paper trading (or forward testing) applies rules to real-time, live data with simulated money. It's slower but tests execution and psychology in the present market.
Bottom Line
In 2026, the ability to backtest trading strategies without coding is a reality, democratizing access to what was once a programmer's domain. The path is clear: define your strategy with unambiguous rules, then leverage powerful no-code platforms like TradingView for rapid automated testing or Thinkorswim OnDemand for realistic discretionary walk-throughs. The ultimate goal is not to find a perfect, curve-fitted past performance, but to build statistical evidence that gives you the confidence to execute a strategy consistently. By rigorously analyzing key metrics like profit factor and max drawdown across a significant sample of trades, while diligently avoiding common pitfalls, you transform trading from a game of hope into one of informed probability.