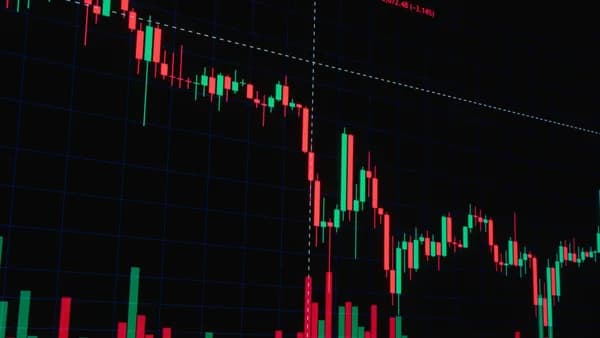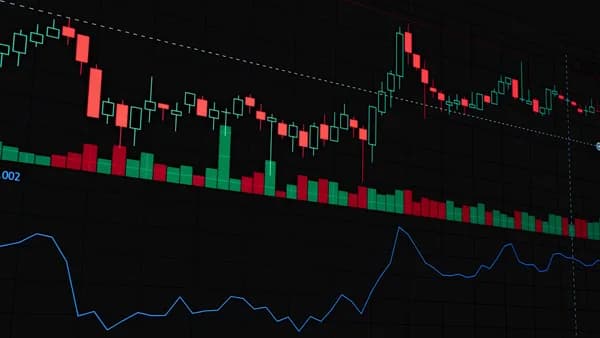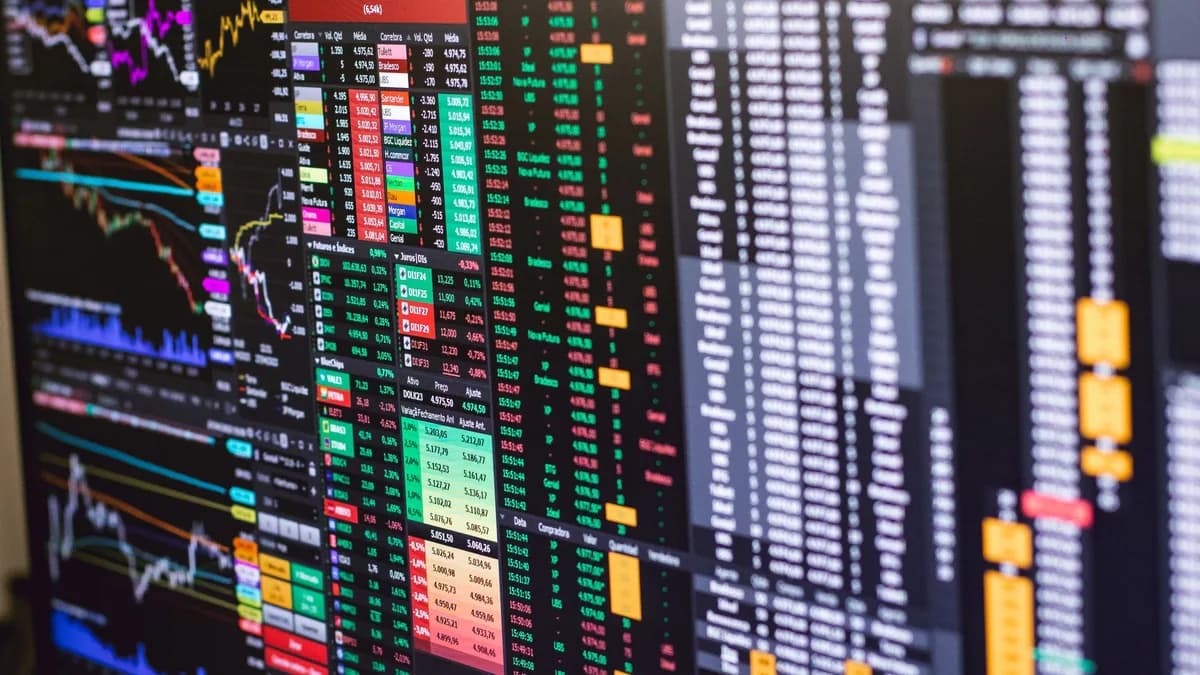
A well-organized multi-chart layout is the cornerstone of an efficient day trading workflow. The difference between a profitable trader and a hesitant one often lies not in their strategy but in their ability to see the full market picture instantly. By mastering how to arrange multiple charts and critical data windows, you eliminate friction, reduce decision latency, and maintain essential market context, turning information into decisive action.
Why Multi-Chart Layouts Are Essential for Speed and Market Context
Trading from a single chart is a significant handicap. As the source data from Supa.is emphasizes, if you trade off a single chart, you are flying blind. Every serious trader checks at least two or three timeframes before entering a position: the daily for trend direction, the 4-hour for structure, and the 1-hour or lower for entry timing. Constantly switching between these timeframes manually causes you to lose context and potentially miss setups obvious on a higher timeframe while you are zoomed into a lower one.
A multi-chart layout solves this by displaying these critical timeframes simultaneously on one screen. This organization allows you to apply what Day Trading Toolkit calls the "Cockpit Principle": positioning the most urgently needed information directly in your line of sight. For day trading, your execution timeframe is Tier 1. Supporting higher and lower timeframes providing context are Tier 2. A proper multi-chart layout brings Tier 2 information immediately adjacent to your primary focus, enabling faster, more informed decisions.
The goal isn't to display the maximum amount of data, it's to display the minimum necessary data in a layout that lets you make fast, accurate decisions without moving your eyes more than you need to.
Platform Overview: TradingView, thinkorswim, MetaTrader, and Interactive Brokers TWS
While several platforms support multi-chart functionality, the sources provide the most detailed guidance for TradingView. It's highlighted as a powerful tool where the multi-chart layout feature is a core component of its "Supercharts." The ability to set up grids of 2, 4, 8, or even 16 charts is tied directly to your subscription tier.
According to the Supa.is and Mr. Chartist sources, here is what each TradingView plan offers as of 2026-04:
| TradingView Plan | Charts per Tab | Approx. Price (Annual) |
|---|---|---|
| Basic (Free) | 1 | $0 |
| Essential | 2 | ~$12.95/month |
| Plus | 4 | ~$24.95/month |
| Premium | 8 | ~$49.95/month |
| Ultimate | 16 | Not specified in sources |
The sources indicate that for most traders, the Plus plan (4 charts) is the "sweet spot," providing enough panels for comprehensive multi-timeframe analysis without being overwhelming. It is also noted that multi-chart layouts are not available on the free plan.
For thinkorswim, MetaTrader, and Interactive Brokers TWS (Trader Workstation), specific multi-chart setup steps are not detailed in the provided sources. However, the core principle of organizing information into zones, Primary Chart, Order Entry, Scanner, Secondary Chart, News/Market Overview, applies universally across any platform capable of displaying multiple windows.
Core Principles: Timeframes, Correlated Assets, and Watchlist Integration
Building a functional layout starts with a clear hierarchy of information. Each chart in your grid should have a dedicated purpose.
Timeframe Hierarchy: The guiding principle from the sources is: higher timeframes for context, lower timeframes for execution. A typical day trading multi-timeframe analysis (MTA) stack might be:
- Tier 1 (Execution): 5-minute or 1-minute chart.
- Tier 2 (Structure/Context): 15-minute or 1-hour chart.
- Tier 3 (Trend Direction): 4-hour or Daily chart.
Correlated Assets: To gain broader market context, you might dedicate one panel to a correlated instrument or market index. For example, if trading a tech stock, one panel could be for the QQQ; if trading forex, one could be for the DXY (Dollar Index). The Multi Trading Charts source notes this helps "spot correlations and trend reversals before they happen."
Watchlist Integration: Your scanner or watchlist is a critical information zone. It should be positioned for quick glances, often best placed in a smaller window adjacent to your primary chart. This allows you to monitor potential setups without taking your eyes off your main trading instrument.
Example Layout 1: Scalping Setup (Multiple 1-Minute Charts + Level 2)
For a scalper focusing on speed and precision, the layout prioritizes the micro-structure and order flow. Based on principles from the sources, a practical 4-chart (TradingView Plus) scalping layout could be:
- Panel 1 (Large, Primary): 1-minute chart of the target asset. This is your main execution view, kept clean with perhaps one or two key indicators like VWAP or a short EMA.
- Panel 2 (Medium): 5-second or 15-second chart of the same asset. This provides ultra-precise entry and exit timing.
- Panel 3 (Medium): 1-minute chart of a correlated index or sector ETF (e.g., SPY if trading a large-cap stock). This provides immediate market context.
- Panel 4 (Small, Static): This space is reserved for your brokerage platform's Order Entry and Level 2 / Time & Sales window. Since TradingView doesn't host direct order entry for all brokers, this panel would physically be a separate window from your trading platform positioned alongside your browser or desktop app, adhering to the Day Trading Toolkit's "Zone 2" principle of having order entry immediately adjacent to your primary chart.
This setup keeps the fastest timeframes and the direct execution tools front and center.
Example Layout 2: Swing Trading Analysis (Daily, 4H, 1H with Volume Profile)
For swing traders analyzing over days or weeks, the layout shifts toward broader structure. The Supa.is source provides a specific example used for a "USDJPY momentum strategy."
- Panel 1 (Large): 4-hour chart. This is identified as the primary "execution timeframe" in the example, showing swing structure. It may include tools like the 20 EMA for dynamic support/resistance and volume profile.
- Panel 2 (Medium): Daily chart. This establishes the core trend direction. It's recommended to keep this clean, perhaps with only long-term moving averages (50-period and 200-period SMA) and key horizontal levels.
- Panel 3 (Medium): 1-hour chart. This is used for refined entry timing, potentially featuring a specific entry indicator like RSI divergence or MACD.
- Panel 4 (Small): This panel could be used for a different correlated pair (like EURUSD) on the 4H timeframe, or for a market breadth indicator.
The key workflow, as described, involves starting with the daily for trend, using the 4H for structure, and watching the 1H for the final trigger, with all three views constantly visible to prevent missing "the forest for the trees."
Organizing Indicators and Drawing Tools to Avoid Clutter
One of the most common mistakes highlighted across sources is indicator overload. The Supa.is guide warns: "If every panel has RSI, MACD, Bollinger Bands, and three moving averages, you are not doing multi-timeframe analysis, you are just duplicating clutter."
Assign specific tools to specific chart roles:
- Trend Charts (Daily/4H): Long-term Moving Averages, major support/resistance lines.
- Structure Charts (1H/15m): Intermediate EMAs, volume, pivot points.
- Entry Charts (5m/1m): One or two precise oscillators or custom scripts for signals.
For drawings, TradingView offers synchronization settings to prevent repetitive work. According to their official support article:
- Sync drawings in layout: Makes drawings appear on every chart for the same symbol within that layout.
- Sync drawings globally: Saves your drawings for a symbol across all your layouts.
"A well-organized workspace is the foundation of efficient trading. TradingView's layout management system allows you to create, save, and dynamically sync multi-chart configurations tailored specifically to your trading style."
Saving, Syncing, and Sharing Custom Workspaces
This is where a platform like TradingView adds significant efficiency. Your custom layout, including chart symbols, timeframes, indicators, and sync settings, can be saved to the cloud.
1. Save Your Layout: In TradingView, after configuring your panels, click the layout name dropdown in the top-left and select "Save Layout As." Give it a descriptive name like "Forex Scalping" or "Stock Swing Analysis." Free users can save 1 layout, while paid tiers can save many.
2. Sync Symbols and Crosshairs: This is a game-changer for multi-timeframe analysis. Use the chain link or "Chart Syncing" icon on a chart's status line. Assign charts you want to link to the same symbol group (e.g., Group A). When you change the symbol on one, all charts in that group update instantly. This also syncs the crosshair, so highlighting a price bar on your 5-minute chart will show the exact same moment on your daily chart.
3. Share via URL (Alternative Tools): The Multi Trading Charts source mentions that its free tool automatically updates your browser URL with your selected symbols and grid settings, allowing you to bookmark and share your custom dashboard.
Hotkeys and Quick Navigation for Faster Execution
Speed is critical. Mastering keyboard shortcuts prevents you from getting lost in menus.
Critical hotkeys for TradingView multi-chart layouts, per the sources:
| Shortcut | Action |
|---|---|
| Alt + Click on a chart | Maximizes or restores that single panel. |
| Tab | Cycles focus between all charts in the layout. |
| Ctrl + S (Cmd + S on Mac) | Saves the current layout. |
| Number Keys (1-9) | Quickly changes the timeframe on the active chart. |
| Ctrl + K (Cmd + K on Mac) | Opens the Global Command Search to find tools, settings, or indicators instantly without menus. |
Using these shortcuts in combination with symbol sync allows you to analyze new instruments across all your preset timeframes in seconds.
Common Pitfalls: Analysis Paralysis and Over-complication
The sources point out several frequent errors:
Mistake 1: Too Many Charts on a Small Screen. "Four charts on a 13-inch laptop is painful." Use a layout appropriate for your monitor size. A 24-inch monitor at 1920x1080 is suggested as a minimum for effective day trading.
Mistake 2: Uniform Indicators Across All Panels. This defeats the purpose of multi-timeframe analysis. Assign roles.
Mistake 3: Neglecting Symbol Sync. Manually updating symbols on multiple charts is a massive inefficiency. Set up sync groups as a one-time task.
Mistake 4: Forgetting to Save. "TradingView does not auto-save layout changes reliably." Always save your layout explicitly after making changes.
Adapting Your Layout for Different Market Conditions (High Volatility vs. Range)
Your layout should be flexible. The Mr. Chartist source recommends creating separate, named layouts for different tasks.
- For High Volatility / News Events: Simplify. You might reduce to a 2-chart layout (1 large, 1 small) focusing solely on your primary execution timeframe and the order entry panel. Remove complex indicators that may fail; focus on pure price action and volume.
- For Ranging / Low Volatility Markets: You can afford more complexity. Expand to a 4-chart grid to monitor multiple assets or timeframes for subtle breakout signals. Incorporate more oscillators like Stochastics or RSI to identify overbought/oversold levels within the range.
- For Sector Rotation Analysis: Use a grid (like 2x2 or 3x3) where each chart is a different sector ETF or a ratio chart (e.g., XLF/SPY), all on the same higher timeframe (like daily).
Have these layouts pre-saved and switch between them instantly as market conditions or your focus changes.
FAQ
What is the best multi-chart layout for beginners? Start simple. On a single monitor, use a layout where the left two-thirds is your primary chart (e.g., 5-minute) and the right one-third is a vertical stack containing your order entry panel, a watchlist, and Time & Sales. As you advance, a 2x2 grid on TradingView's Plus plan is an excellent next step for multi-timeframe analysis.
Can I use a multi-chart layout on TradingView Mobile? No. According to the Supa.is source, multi-chart layouts are desktop/web only. The mobile app is limited to a single chart view.
How do I sync my drawings so they don’t disappear when I switch symbols? In TradingView, use the drawing sync settings on the left toolbar. "Sync drawings in layout" will maintain drawings for a specific symbol across all charts in your current workspace. "Sync drawings globally" will save them for that symbol across all your layouts.
Is there a free way to view multiple TradingView charts at once? The Multi Trading Charts platform offers a free web tool that generates grids of public TradingView widgets. However, for full functionality, saved workspaces, and direct synchronization features within the TradingView ecosystem, a paid plan is required.
What’s more important, more monitors or a better layout? The sources are clear: organization beats equipment. A clean, purposeful layout on a single monitor will outperform a cluttered, disorganized setup across multiple monitors every time. More screens simply provide more real estate to execute a good organizational plan.
Bottom Line
An effective multi-chart layout is not about filling every pixel with data; it’s a deliberate system designed to minimize friction and maximize context. The core takeaways from the research are: start with the cockpit principle, assigning specific roles to each chart zone; leverage synchronization features to save time; use hotkeys for speed; avoid clutter by assigning indicators purposefully; and save distinct layouts for different trading styles and market conditions. Whether you use TradingView’s tiered system or another platform’s multi-window tools, the goal remains the same: to build a workspace where your strategy can be executed with clarity, speed, and confidence.