
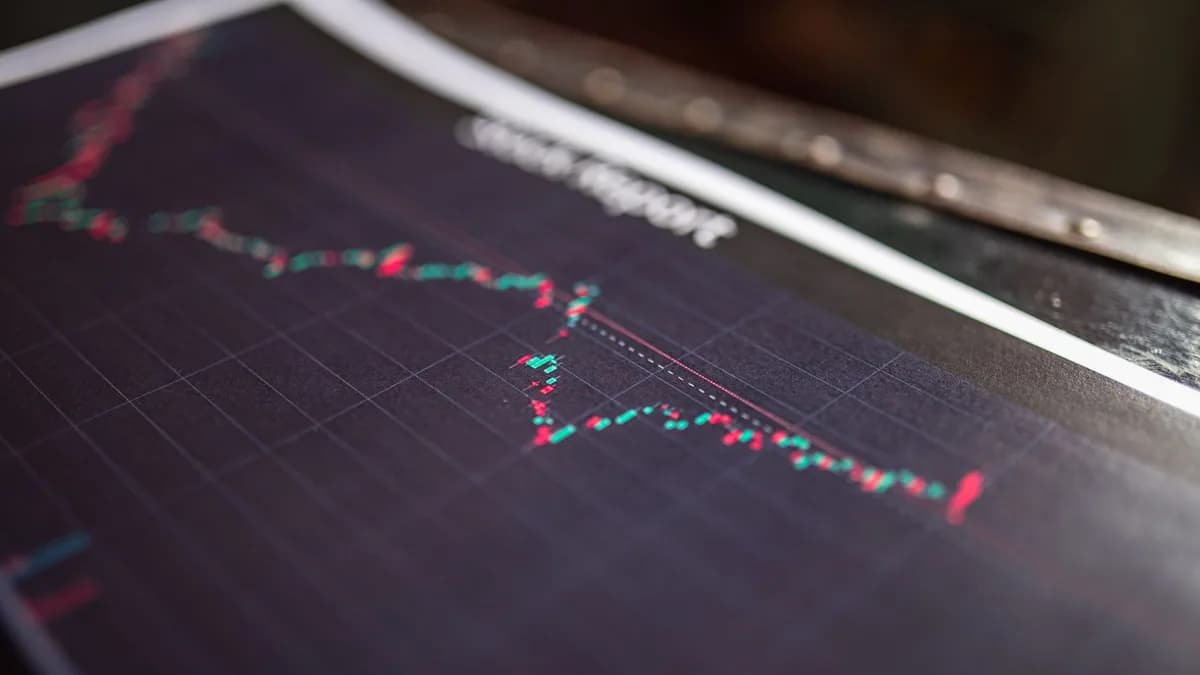
West Texas Intermediate (WTI) oil reversed lower Wednesday, shedding early gains linked to a blockade of the world's most critical oil chokepoint, as a historic build in U.S. crude inventories shocked traders into reality. The price slid 0.77% to $81.60, according to FXStreet, because a fundamental rule of oil trading still holds: geopolitics sets the mood, but inventory data pays the bills. Today, the bill came due from a massive 17.4-million-barrel surge in U.S. commercial stockpiles. This clash between fear and fact is the premiere for a volatile third quarter, one where every headline from the Strait of Hormuz will now be judged against the hard numbers in Cushing, Oklahoma.
TradingAugust 13, 2026· 8 min read· By XOOMAR Insights Team
Oil’s Biggest Stockpile Surge Since 2023 Shock Traders
Updated on August 13, 2026
XOOMAR Intelligence
Analyst Take
55/ 100
2 sources analyzedLow confidenceTrend10Freshness100Source Trust84Factual Grounding76Signal Cluster20
The Huge Inventory Build That Broke the Strait of Hormuz Rally
The American Petroleum Institute (API) reported a colossal 9.072-million-barrel crude inventory build last week. The official Department of Energy data was even more staggering: a 17.4-million-barrel increase, the largest since January 2023. Markets had expected a draw of half a million barrels. This wasn't a data miss. It was a demolition.
The increase, the largest since February, helps explain Wednesday's reversal despite an increasingly tight global supply outlook.
The drivers were specific and telling. U.S. crude imports surged to their highest level since November 2024, fueled by a return of Saudi oil and a rise in Venezuelan barrels. Simultaneously, U.S. crude exports slumped to their lowest since November 2025. The result was a tidal wave of oil hitting U.S. shores with nowhere to go but storage. Even as refiner runs hit their highest seasonal level since 2019, they couldn't process the inbound tide fast enough. Stocks at the critical Cushing, Oklahoma hub continued a slow climb from operational lows.
XOOMAR Interpretation: This data injects a heavy dose of pragmatism into a market drunk on geopolitical risk. That 17.4-million-barrel cushion represents a tangible buffer. In a single week, the U.S. added a supply reserve larger than many countries' strategic stockpiles. For traders betting on a prolonged Hormuz crisis, this number forces a brutal calculation: how many days of global disruption does this U.S. surplus actually offset? The immediate price reversal answers that question, for now, the buffer matters more than the blockade.
Iran's "Survival Economy" Versus Trump's "Total Control"
While tanks filled in Oklahoma, a tense stalemate continued half a world away. U.S. President Donald Trump asserted that US forces are in “total control” of the Strait of Hormuz. Iran’s Supreme National Security Council Secretary, Mohsen Rezaei, laid out Tehran's price for reopening the waterway: an end to the US war and blockade, the release of frozen Iranian assets, and a regional ceasefire.
The standoff is being tested on the water. US forces disabled a Panama-flagged cargo ship with Hellfire missiles after it ignored warnings while attempting to sail toward an Iranian port. Yet, as analysts at Rabobank note, the market narrative often shifts to more upbeat signals. They point to Iran “defying US pressure by becoming a ‘survival economy’” and to political claims, like those from Pakistan, that a US-Iran deal is close.
Rising physical disruptions beyond Hormuz are adding to the pressure. Refinery attacks have hit Russia and Libya, while Houthi attacks on Saudi Arabia's Jazan complex threaten a key alternative export route through the Red Sea. The International Energy Agency (IEA) now forecasts global oil supply to decline by 4.3 million barrels per day this year, a steeper drop than previously projected, due to these Middle East and Russian losses.
XOOMAR Analysis: This creates a dangerous feedback loop. Each proactive US enforcement action, like striking a vessel, is designed to assert control but also raises the risk of a miscalculation that triggers a sharper escalation. Iran’s strategy appears to be one of endurance, betting its "survival economy" can outlast political pressure. The market is caught between these two timelines: the immediate risk of a kinetic event and the grinding reality of a prolonged economic siege.
The IEA's Stark Math: A Shrinking Buffer for a Breaking World
The global inventory picture outside the U.S. is moving in the opposite direction, tightening the vise. The IEA reports that global oil inventories fell by 2.2 million barrels per day last month, pushing total stocks below 7.9 billion barrels for the first time since April 2025. The agency's forecast is sobering: it now expects a global oil market deficit of 1.8 million bpd in the third quarter, more than double its July estimate.
This is the core tension. The world is draining its collective storage while the U.S., momentarily, is flooding its own. The IEA's warning is clear: “Rapidly declining inventories are increasing the urgency of reopening the Strait of Hormuz and reducing the buffer available to absorb further supply disruptions.”
However, demand is weakening in tandem. The IEA forecasts global oil demand to decline by 1.6 million bpd this year, a 47% larger drop than projected in July. Higher prices and supply constraints are themselves killing consumption. This was evident in the U.S., where gasoline demand remained surprisingly resilient despite prices averaging over $4 per gallon. Demand was only 0.4% lower year-on-year, suggesting consumer tolerance has limits but hasn't yet broken.
What does this mean for the fear premium? The market structure tells the story. Both Brent and WTI curves remain in backwardation (where near-term prices are higher than later dates), and refining margins are elevated. This signals ongoing near-term physical scarcity. However, bullish options bets have cooled, with 25-delta call skews dropping to their least bullish levels since July 10. Traders are hedging against spot disruptions but are increasingly pricing a path toward de-escalation, as we explored in our analysis of WTI Crude Nearing $83 as a Geopolitical Flashpoint.
For Physical Traders Versus Speculators: A Market of Two Minds
The current volatility exposes a fundamental rift in how different market participants view risk.
- The Physical Trader's World is governed by tankers, refining schedules, and pipeline flows. For them, the 17.4-million-barrel U.S. build and the surge in imports are the dominant facts. It means more optionality and less panic buying. Their focus is on the Strategic Petroleum Reserve (SPR), which saw 6.1 million barrels drawn last week, continuing a release program that has taken 117 million barrels out of the caves since late March.
- The Speculator's Narrative is driven by headlines from the Persian Gulf, option gamma, and technical charts. For them, the Hellfire missiles and Iran's closure demands define the landscape. They see the IEA's shrinking global buffer and bet that any single incident could ignite a short-covering rally.
Rabobank analysts summarize this "routine" where “the Middle East situation remains worrying, but markets reacted to more positive narratives.” They suggest this uneasy balance may persist until after the U.S. midterm elections. Fund positioning data would likely show this split personality: large money managers may be long oil on a strategic horizon but are quick to take profits on bearish inventory shocks, creating the whipsaw action seen Wednesday.
The Next Triggers: What Could Shatter the Fragile Balance
The market is now navigating a narrow channel between two powerful forces. Watch these specific pressure points to see which one breaks first:
- The Diplomatic Mirage: Any substantive meeting, perhaps building on Pakistan's claimed “template of peace,” could collapse the risk premium swiftly. Conversely, the failure of such talks would solidify it.
- The Insurance Rate Benchmark: A sustained drop in war risk insurance premiums for tankers transiting the Gulf would be a tangible signal the industry sees de-escalation. A spike would be a clear red alert.
- The U.S. Inventory Follow-Through: Was this a one-week import tsunami or a new trend? The next API and DOE reports will confirm if the U.S. is rebuilding a meaningful strategic buffer or if the Hormuz-driven global drain will reassert dominance.
- The Technical Floor and Ceiling: As per the FXStreet analysis, WTI finds initial support near $80.00, with a major structural floor between the 100-period and 200-period Simple Moving Averages around $78.73, $78.76. A break below $77.50 would signal the inventory glut is overwhelming all geopolitical fear. Resistance sits at $84.50 and then $86.62. A breach there means the market has fully priced in a prolonged, disruptive crisis, similar to the dynamics seen during the initial Strait of Hormuz Shutdown.
XOOMAR's Final Take: Wednesday's price action was a masterclass in market psychology. It revealed that while traders are willing to pay a premium for Hormuz risk, that premium has a limit defined by visible, towering stacks of crude oil. The path forward is a tug-of-war between depletion and accumulation. Until one trend is decisively broken, by either a shocking supply disruption or a second consecutive massive inventory build, WTI will likely chop violently within the $78, $86 range, a monument to a world trying to decide if it's on the brink of a crisis or simply staring nervously over the edge.
Disclaimer: This XOOMAR analysis is for informational and educational purposes only. It is not financial, investment, legal, tax, or professional advice. It does not provide buy, sell, hold, price-target, portfolio, or personalized recommendations. Verify information independently and consult qualified professionals before making decisions.
The Bottom Line
- Massive inventory builds can overpower geopolitical risk premiums, leading to sharp price reversals.
- The clash between supply fears and actual stockpiles data creates extreme volatility for traders and investors.
- High imports and low exports signal shifting global oil flows that directly impact U.S. energy prices and security.
U.S. Crude Inventories: Reported vs. Expected
Expected Draw
million barrels-0.5
API (Reported)
million barrels9.072
DoE (Reported)
million barrels17.4
Sources
Disclaimer: Content on XOOMAR is produced using AI-assisted research, drafting, and verification workflows and is intended for informational and educational purposes only. It does not constitute financial, investment, legal, tax, medical, or professional advice of any kind. All analysis reflects available information at the time of publication and may not be current. Verify information independently and consult qualified professionals before making decisions. Editorial policy

Written by
XOOMAR Insights Team
Research and Editorial Desk
The XOOMAR Insights Team pairs automated research with human editorial judgment. We track hundreds of sources across technology, fintech, trading, SaaS, and cybersecurity, cross-check the facts, and explain what happened, why it matters, and what to watch next. We do not just rewrite headlines. Every article is fact-checked and scored for reliability before it goes live, and we link back to the original sources so you can verify anything yourself.
Explore More Topics
Related Articles
 Trading
7% Rout Grips Brent Oil Prices as Trump Pauses Iran Strikes
Brent sank over 7% after Trump paused new Iran strikes, but Hormuz remains effectively closed and supply risk still hangs over crude.
Aug 3, 20266 min
 Trading
Trump Demands Iran Pay as Iran Deal Collapse Jolts Oil 7%
Diplomatic posturing dashed any hope for a quick US-Iran deal, triggering a 7% surge in crude oil prices and a global scramble for safety assets, overriding all
Aug 11, 20267 min
 Trading
8% Wipeout Crushes WTI Crude Oil on Iran Deal Hopes
WTI crude oil slid nearly 8% as Iran deal hopes cut the war premium and dragged Hormuz risk back into focus.
Aug 3, 20266 min
 Trading
Euro Drops as US-Iran Peace Hopes Fade
The Euro retreated as hopes for a quick US-Iran peace deal vanished, removing a key support. The stalemate is pushing oil prices higher, creating a painful econ
Aug 11, 20267 min
 Trading
Strait of Hormuz Shutdown Lifts Oil Prices 6%
WTI crude oil jumped over 6% after Iran confirmed talks on shipping routes don't mean the Strait of Hormuz will reopen, setting the stage for a prolonged geopol
Aug 10, 20268 min
 Global Trends
Putin Warns of Retaliation for Commercial Ship Seizures
President Vladimir Putin has threatened direct retaliation against Western nations for seizing Russian commercial ships, calling the actions 'piracy' and riskin
Aug 12, 20265 min
 Global Trends
Global Oil Supply Crashes by 4.3 Million Barrels
The IEA forecasts a steep 4.3 million barrels per day drop in global oil supply this year, shifting from market risk to active constraint as Middle East chokepo
Aug 12, 20266 min
 Fintech
Western Union Buys a Sinking Ship for $500 Million
Western Union's $500 million deal for remittance firm Intermex looks disastrous as revenue plunges 18%, revealing the company's frantic—and failing—defense agai
Aug 12, 20266 min
 Global Trends
Typhoon Dolphin Unloads Beijing's Annual Rainfall in a Day
Typhoon Dolphin is delivering over a third of Beijing's annual rainfall in just 24 hours, forcing thousands to evacuate and testing the inland capital's flood d
Aug 13, 20268 min
 Global Trends
Hero's Assault Charges Scrapped in Deferred Prosecution Deal
Australian hero Ahmed al-Ahmed will not face assault charges after agreeing to a court order, as the prosecution withdrew its case following the alleged victim'
Aug 13, 20265 min
Don't miss the signal
Get our weekly roundup of the stories that matter across tech, fintech, and trading. No noise, just signal.
Free forever. No spam. Unsubscribe anytime.