
West Texas Intermediate crude spiked more than 6% on Monday as markets priced in a glaring truth: there’s no clear path to reopen the Strait of Hormuz.
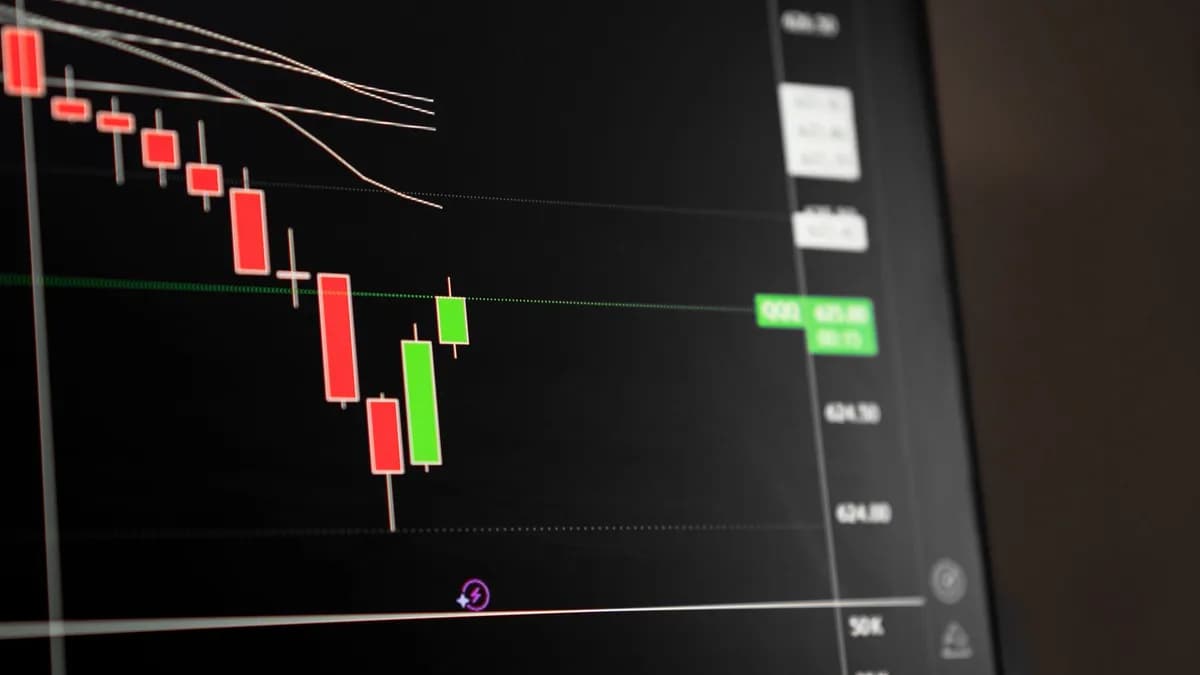
TradingAugust 10, 2026· 8 min read· By XOOMAR Insights Team
Strait of Hormuz Shutdown Lifts Oil Prices 6%
Updated on August 10, 2026
XOOMAR Intelligence
Analyst Take
71/ 100
4 sources analyzedLow confidenceTrend20Freshness98Source Trust84Factual Grounding94Signal Cluster40
WTI rallied to trade around $81.15 per barrel, erasing last week's losses in a single session, according to FXStreet. The sharp reversal came despite Iranian Foreign Minister Abbas Araghchi announcing that talks with Oman on defining new shipping lanes were in their "final stages." Tehran bluntly clarified that an agreement on routes alone "would not reopen the waterway." Iran's demands | a U.S. naval blockade lift, sanctions relief, compensation, and security guarantees | set up a direct confrontation with Washington, where President Donald Trump on Friday rejected the asks and counter-demanded compensation for U.S. casualties. This isn't a temporary shipping delay. It’s a high-stakes geopolitical deadlock with no off-ramp in sight, and crude prices are just beginning to reflect the implications.
The Strait of Hormuz Is Global Energy's Single Point of Failure
Forget routine chokepoints. The Strait of Hormuz is the world's most fragile energy artery, and its closure is an explosive stress test for global supply chains. Roughly 20% of the world's daily oil supply, and nearly 25% of all globally traded liquefied natural gas, passes through this narrow waterway. When it closes, there is no true alternate route. The immediate 6% price spike in WTI is more than a reaction to headlines. It's the market beginning to price in a realistic, prolonged standoff.
The source material shows the bounce wasn't triggered by a new attack or incident, but by the evaporation of hope for a quick fix. Prices fell briefly last week on rumors of a deal, but "the decline proved short-lived as no final announcement followed." The subsequent surge reveals how thin the margin for error has become. With Iranian state media suggesting Tehran could wait until January 20, 2029 | the end of the current U.S. presidential term | before returning to talks, the market is grappling with a scenario measured in years, not weeks.
The Math of a Blockade: How Many Barrels Are Actually At Stake
While the source doesn't provide the exact daily volume, the scale is well-documented in public data: over 21 million barrels of oil per day transit the Strait. This isn't just any oil. It's primarily medium-sour crudes from Saudi Arabia, Iraq, the UAE, and Kuwait, along with Iranian condensate. These grades feed massive refining complexes in Asia and are benchmarked against Brent, not WTI.
The immediate "call on" other global supplies is staggering. The U.S. Strategic Petroleum Reserve and other national stockpiles can provide a buffer, but they are finite. The speed at which U.S. shale, West African, or Atlantic Basin producers can ramp up to replace this volume is limited by infrastructure and decline rates. The $81.15 price for WTI, a U.S.-linked crude, is a telling signal. It means the disruption is already being seen as a global, not regional, supply crisis, pulling all benchmark prices higher. A 6% jump might be a conservative opening bid if the closure persists beyond a few days, as the physical shortage of specific crude types begins to bite.
From Suez to Hormuz: A History of Chokepoint Crises and Market Reactions
Past disruptions offer a rough playbook, but the script this time is different. The Suez Canal blockage of 2021 was a logistical accident resolved in days. Historical Hormuz tensions, like tanker seizures or attacks, were episodic and didn't halt all traffic. This is a full, state-enforced closure with a list of non-negotiable political demands attached.
XOOMAR Analysis: Historical patterns suggest an initial price spike is almost guaranteed, but the magnitude and duration depend on the perceived longevity of the disruption and global inventory levels. The key difference now is the diplomatic stalemate. Unlike a stuck ship, there's no tugboat solution. The source material shows a complete breakdown in U.S.-Iran channels: "US-Iran diplomacy appears to be at a stalemate, with Tehran denying direct talks with Washington." This lack of a communication channel is what transforms a blockade from an incident into a structural market shock. The "unknown unknown" isn't another military escalation. It's the complete absence of a process to de-escalate.
The Winners, Losers, and Nervous Bystanders in the Energy Standoff
The immediate beneficiaries are producers with secure export routes completely independent of the Strait.
| Winners | Losers & Vulnerable Parties |
|---|---|
| U.S. Shale Producers: Can sell WTI at a now-higher global price. | Asian Importers (China, India, Japan): Heavily reliant on Gulf crude. |
| Atlantic Basin Producers (Brazil, Norway, Guyana): Their crude becomes premium. | European Refineries: Dependent on Iraqi and Saudi crude. |
| Traders & Companies with Stored Physical Barrel: Can sell at a massive premium. | Airlines, Trucking, Industrials: Face immediate fuel cost inflation. |
The conflicted stakeholders are perhaps the most interesting. Russia and some OPEC+ members benefit from higher prices but fear an uncontrollable regional war that could damage infrastructure or draw in direct military involvement. Gulf Cooperation Council states are in a perilous position: they benefit from higher prices but see their only export route controlled by an adversarial regional power.
This crisis also spotlights the strategic value of infrastructure bypassing the Strait, as we explored in our analysis of Amazon's Texas Gas Power Plant Betrays Climate Pledge, which, while focused on gas, underscores the growing premium on secure, geographically diversified energy assets.
What $81 Oil Means for Your Wallet, Your Portfolio, and the Fed
The translation from headline price to real-world impact is direct and brutal.
Gasoline: For U.S. drivers, every sustained $10 per barrel increase typically adds 25 to 30 cents to a gallon of gasoline. The move from last week's lows near $77 to over $81 suggests an immediate 10-12 cent per gallon headwind, with more to come if prices keep climbing.
Portfolios: The divergence in equity performance will be stark. Pure-play shale E&Ps, midstream companies with non-Gulf exposure, and oilfield services stand to gain. Sectors like airlines, consumer discretionary, and anything with heavy freight costs face a sudden margin squeeze. The volatility also reinforces the flight to safety, echoing the dynamic we saw in Sterling Slips as Hormuz Fears Prompt Safe-Haven Dollar Rush, where geopolitical stress fuels demand for the dollar and rattles risk assets.
Central Banks: This is a nightmare scenario for inflation fighters. A sustained oil price surge directly lifts headline inflation figures and seeps into core prices via transportation and input costs. It complicates any central bank's path to rate cuts, potentially forcing a "higher for longer" stance even if economic growth slows, a tension we examined in Stocks Ignore Record Job Losses as Fed Pledge Trumps Payrolls. The Fed now must contend with re-emerging supply-driven inflation alongside any demand concerns.
The Long Shadow of Uncertainty: Energy Markets Brace for a New Era of Instability
The road ahead points toward protracted brinkmanship, not diplomatic resolution. The source material lays out incompatible positions: Iran's multi-point demands versus Washington's refusal and counter-claims. With Tehran potentially willing to wait out the current U.S. administration, the closure could define energy markets for years.
This shock will accelerate structural shifts already in motion. Investments in pipelines bypassing the Strait (like Iraq's pipeline to Jordan) will gain urgency. So will investments in production from secure jurisdictions, from the U.S. to Brazil. Most consequentially, it permanently recalibrates oil's "geopolitical risk premium." Markets will no longer view the Strait of Hormuz as a permanently open transit route. They will price in a tangible, non-zero probability of closure into the long-term curve. That means a few dollars per barrel added to the floor price of crude, permanently.
What to Watch Next:
- Physical Market Arbitrage: Watch the spread between Brent and WTI. A widening spread signals the market believes the disruption is concentrated on Gulf-linked crudes. A parallel surge in both suggests a full-blown global shortage.
- U.S. SPR Releases: Any announcement of a major coordinated stockpile release would be an attempt to cap prices and signal resolve, but would be a temporary fix.
- Diplomatic Backchannels: The first sign of a potential deal won't be a headline from Araghchi or Trump. It will be a quiet meeting in a third country. Until that happens, the risk premium only grows.
The Strait of Hormuz isn't just closed. It's become the world's most expensive geopolitical bargaining chip, and the cost is being added to every barrel of oil sold.
Disclaimer: This XOOMAR analysis is for informational and educational purposes only. It is not financial, investment, legal, tax, or professional advice. It does not provide buy, sell, hold, price-target, portfolio, or personalized recommendations. Verify information independently and consult qualified professionals before making decisions.
Impact Analysis
- The Strait of Hormuz is the transit point for 20% of global daily oil supply and 25% of traded LNG, making a prolonged closure catastrophic for energy security.
- The 6% price spike isn't a temporary reaction but the market pricing in a realistic, extended geopolitical standoff with no clear resolution.
- This deadlock directly impacts consumers worldwide through higher fuel costs and threatens to destabilize an already fragile global economy.
WTI Price Movement
Previous price
%0
Current price
%6
Sources
Disclaimer: Content on XOOMAR is produced using AI-assisted research, drafting, and verification workflows and is intended for informational and educational purposes only. It does not constitute financial, investment, legal, tax, medical, or professional advice of any kind. All analysis reflects available information at the time of publication and may not be current. Verify information independently and consult qualified professionals before making decisions. Editorial policy

Written by
XOOMAR Insights Team
Research and Editorial Desk
The XOOMAR Insights Team pairs automated research with human editorial judgment. We track hundreds of sources across technology, fintech, trading, SaaS, and cybersecurity, cross-check the facts, and explain what happened, why it matters, and what to watch next. We do not just rewrite headlines. Every article is fact-checked and scored for reliability before it goes live, and we link back to the original sources so you can verify anything yourself.
Explore More Topics
Related Articles
 Trading
WTI Crude Paralyzed at $74 Amid Hormuz Showdown
WTI crude prices are stuck near three-week lows, not due to calm but to paralysis as traders await a binary outcome for the Strait of Hormuz that could detonate
Aug 6, 20267 min
 Trading
War Premium Vanishes as WTI Oil Plunges 7.76% on Iran Talks
WTI oil fell 7.76% as Trump paused a strike on Iran, stripping out the war premium tied to the Strait of Hormuz.
Aug 3, 20265 min
 Trading
8% Wipeout Crushes WTI Crude Oil on Iran Deal Hopes
WTI crude oil slid nearly 8% as Iran deal hopes cut the war premium and dragged Hormuz risk back into focus.
Aug 3, 20266 min
 Trading
7% Rout Grips Brent Oil Prices as Trump Pauses Iran Strikes
Brent sank over 7% after Trump paused new Iran strikes, but Hormuz remains effectively closed and supply risk still hangs over crude.
Aug 3, 20266 min
 Trading
Iran Demands Shipping Toll To Reopen Oil Chokepoint
Global markets rallied on news of the Strait of Hormuz reopening, but the deal would grant Iran unprecedented control to collect transit tolls.
Aug 6, 20266 min
 Global Trends
Oil Plunges 2% on Secret Iran Peace Deal Hints
Crude oil prices dropped 2% on unconfirmed reports that a ceasefire deal between the U.S. and Iran could reopen the Strait of Hormuz, despite ongoing attacks on
Aug 10, 20267 min
 Fintech
CPI Print Holds Key to Crypto Rally or Ruin
Crypto's fate this week balances on a knife edge, with the July CPI report poised to dictate Fed policy and market risk appetite, while earnings reveal which co
Aug 10, 20266 min
 Fintech
McDonald's Hits Traffic Snag After Ditching App Deals
McDonald's U.S. sales growth stalled after it replaced popular digital app deals with an inconsistent value menu, a move its CEO called a 'bad trade' that alien
Aug 9, 20264 min
 Fintech
CFPB Opens Gate for Banks to Charge Open Banking Fees
The CFPB may scrap its ban on data-access fees, allowing banks to charge third-party apps for your transaction history and potentially crippling the free flow o
Aug 10, 202610 min
 Technology
Bluesky Hides Reposts From That One Annoying Account
Bluesky added a feature allowing users to hide reposts from specific accounts they follow, a targeted tool for feed curation without unfollowing.
Aug 10, 20267 min
Don't miss the signal
Get our weekly roundup of the stories that matter across tech, fintech, and trading. No noise, just signal.
Free forever. No spam. Unsubscribe anytime.