
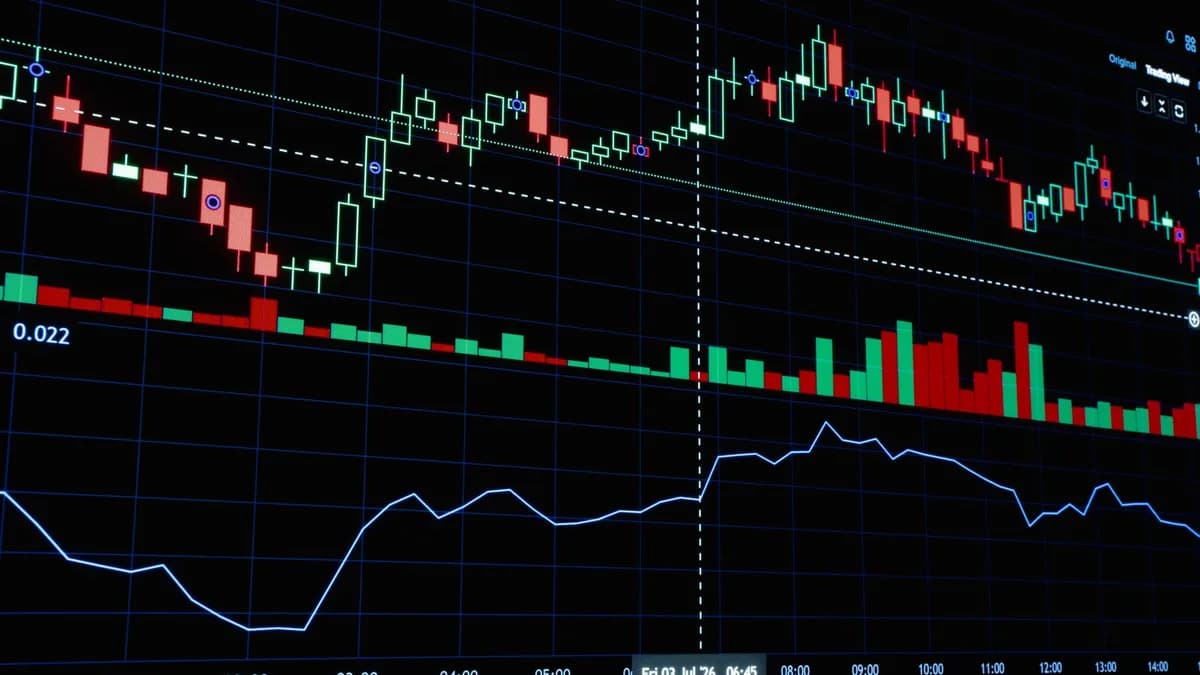
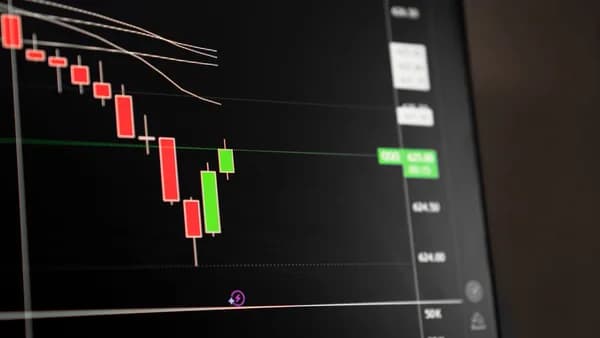
West Texas Intermediate crude oil is testing a line in the sand at $83.00. For the third consecutive day, buyers have pushed the US benchmark toward this barrier, trading just below it during Wednesday's Asian session and hovering close to a nearly two-week high, according to FXStreet. The move is technically clean and geopolitically charged. But until the price closes decisively above that level, this rally is just another potential head-fake in a volatile market. The entire short-term trajectory for crude now hinges on this single digit.
TradingAugust 12, 2026· 7 min read· By XOOMAR Insights Team
WTI Crude Nears $83 Threatening Geopolitical Flashpoint
Updated on August 12, 2026
XOOMAR Intelligence
Analyst Take
62/ 100
3 sources analyzedLow confidenceTrend20Freshness99Source Trust84Factual Grounding91Signal Cluster40
Why $83 Is the New Crude Oil Danger Zone
This isn't a routine uptick. The current price action is a critical stress test for market conviction. Technically, WTI is wrestling with the 38.2% Fibonacci retracement level of its July-August slide, a common initial hurdle for any recovery. Holding above it maintains a near-term bullish bias, but it's a fragile one. The market's next immediate target is the 50% retracement at $82.93, followed by the 61.8% level at $85.13.
A breakout above $83 does more than tick a box on a chart. It signals that the buying pressure is robust enough to absorb the sell orders that typically cluster at these key technical junctures. Without that breakout, the rally lacks credibility and remains vulnerable to a swift reversal back toward support at $80.73 or lower. The number is simple, but the battle over it is complex.
The Pressure Cooker: Geopolitics and OPEC+ Discipline Are Still Cranking The Heat
Fundamentals are providing the ammunition for this technical advance. Two specific events are acting as a hard floor under prices:
- An advisor to Iran’s Supreme Leader stated the Strait of Hormuz will not be opened until the U.S. meets Tehran's demands.
- Fresh strikes by Yemen’s Iran-backed Houthis on Red Sea shipping continue to fuel concerns over regional supply disruptions.
"An advisor to Iran’s Supreme Leader Mojtaba Khamenei said on Tuesday that the Strait of Hormuz will not be opened until the US meets Tehran's demands."
These events directly threaten chokepoints for global crude flows, putting a geopolitical risk premium back into the price. This comes atop the continued, albeit quieter, backdrop of OPEC+ production restraint. The combination creates a supply-side "pressure cooker" that prevents prices from collapsing, even when demand worries surface. These fundamentals are the fuel. The $83 level is the lid. For more on how Strait of Hormuz tensions directly impact markets, see our previous analysis in Strait of Hormuz Shutdown Lifts Oil Prices 6%.
Reading the Numbers: The Specific Indicators Fueling This Three-Day Rally
The technical setup supporting the move is notably constructive, not overextended.
- The Relative Strength Index (14) sits at 64.63. This is firmly in positive, bullish territory but has not yet crossed into the overbought zone (typically above 70), suggesting room for further upside before the market is considered "too hot."
- The Moving Average Convergence Divergence (MACD) indicator is in positive territory, reinforcing that underlying momentum favors the bulls.
This three-day push during Asian trading hours is significant. It indicates sustained buying interest is emerging, not just a one-off spike. The price is now challenging its highest level in nearly two weeks, a clear attempt to break the immediate downtrend structure. The velocity of the move off recent lows shows committed capital entering, not just speculative froth.
Crude's Clashing Worldviews: The Trader, The Analyst, and The End-User
Three different market participants see three different stories unfolding at $83.
The Technical Trader sees a clean setup. The play is to scalp the range between support ($80.73) and resistance ($83.00), or prepare for a breakout long position targeting $85.13. It's a pure price-action game.
The Macro Analyst is flashing caution. While geopolitics provide support, they see a rally that looks fragile against potential economic headwinds. They question whether supply fears alone can sustainably drive prices higher if global demand growth is stalling. For them, a breakout above $83 needs to be confirmed by strong fundamental data, not just charts.
The End-User (an airline, a shipping company, a chemical manufacturer) is watching nervously. Another sustained leg higher in crude directly attacks their input costs and profit margins. For them, $83 isn't a technical level, it's an inflation signal. A close above it means reassessing hedges and preparing for potential cost pressures to re-enter the broader economy.
A Brief History of Resistance: What Happens When Oil Hits These Technical Tripwires
Markets have memory. Key Fibonacci levels like the 38.2% or 50% retracements are not arbitrary. They are dense concentrations of past limit orders, stop-losses, and the emotional pain of prior trades. A rejection at this zone would not be unusual.
XOOMAR Analysis: While the source material does not provide a specific recent example, the principle is critical. In the recent July-August decline, similar minor rebounds were likely sold into at defined resistance levels. The current environment differs because the geopolitical trigger (explicit Strait of Hormuz threats) is more acute than the general risk-off sentiment driving past selloffs. This could provide the extra impetus needed to break through, but it's not guaranteed. The lesson is that a failure here would show that even heightened Middle East tensions have a limited price impact when confronted with a wall of technical selling.
Breaking $83 Means More Than a Number: It's a Signal for the Entire Energy Complex
A sustained daily close above $83.00 would ripple far beyond the futures pit.
| Asset Class | Likely Impact of a Sustained Breakout |
|---|---|
| Energy Stocks | Sector ETFs (XLE) and drilling shares would likely see bullish realignment, chasing the underlying commodity higher. |
| Inflation & The Fed | Reintroduces "sticky" energy price pressure into the policy calculus, potentially complicating the path to rate cuts. |
| Currency Markets | Bolsters commodity-linked currencies like the Canadian Dollar (CAD) and Norwegian Krone (NOK), while pressuring the currencies of major oil importers. |
| Retail Trader Strategy | Shifts the framework from range-bound, sideways plays to trend-following strategies looking for a run toward $85 and beyond. |
The breakout would confirm that the geopolitical risk premium has a specific, quantifiable value in the current market. It moves oil from being a contained problem to a broadening market driver. This dynamic, where oil surges in tandem with the dollar and gold, was explored in our coverage of the Dollar, Gold, Oil Surge in Unprecedented Crisis Alignment.
The Week Ahead: Catalysts That Could Seal the Breakout or Trigger a Sharp Reversal
The tension between the technical breakout attempt and the fundamental macro landscape will be arbitrated by imminent data.
The immediate catalyst is the weekly EIA crude inventory report. A significant drawdown in stocks would be the fundamental confirmation the bulls need to smash through $83, validating the supply disruption narrative. A surprise build, however, would undermine the rally and could trigger a sharp rejection back toward the $80.73 support layer.
Two clear paths are now mapped:
- Breakout Path: A daily close above $83.00 opens a move toward $85.13 (61.8% Fibo). The next major barrier is the prior cycle high of $92.26.
- Rejection Path: A failure to breach $83 leads to a pullback. Initial support is $80.73 (38.2% Fibo), followed by $78.00. A deeper correction could target the $73.60 swing low.
The trader's watchlist is simple: Watch for a daily close, not just an intraday spike. Watch the EIA inventory number. And watch the headlines from the Strait of Hormuz. The market has shown its hand. Now it needs a fundamental card to win the pot.
Disclaimer: This XOOMAR analysis is for informational and educational purposes only. It is not financial, investment, legal, tax, or professional advice. It does not provide buy, sell, hold, price-target, portfolio, or personalized recommendations. Verify information independently and consult qualified professionals before making decisions.
The Bottom Line
- WTI crude oil trading near $83.00 signals whether the market has enough conviction to sustain a recovery, impacting global energy prices.
- A breakout above or reversal from this level will determine short-term trajectory and influence trading strategies across commodities.
- Ongoing geopolitical tensions in the Strait of Hormuz and Houthi Red Sea attacks directly threaten supply routes, keeping price volatility elevated.
WTI Key Technical Levels
38.2% Fibo (Current)
$83
50% Fibo
$82.93
61.8% Fibo
$85.13
Support
$80.73
Sources
Disclaimer: Content on XOOMAR is produced using AI-assisted research, drafting, and verification workflows and is intended for informational and educational purposes only. It does not constitute financial, investment, legal, tax, medical, or professional advice of any kind. All analysis reflects available information at the time of publication and may not be current. Verify information independently and consult qualified professionals before making decisions. Editorial policy

Written by
XOOMAR Insights Team
Research and Editorial Desk
The XOOMAR Insights Team pairs automated research with human editorial judgment. We track hundreds of sources across technology, fintech, trading, SaaS, and cybersecurity, cross-check the facts, and explain what happened, why it matters, and what to watch next. We do not just rewrite headlines. Every article is fact-checked and scored for reliability before it goes live, and we link back to the original sources so you can verify anything yourself.
Explore More Topics
Related Articles
 Trading
Iran Demands Shipping Toll To Reopen Oil Chokepoint
Global markets rallied on news of the Strait of Hormuz reopening, but the deal would grant Iran unprecedented control to collect transit tolls.
Aug 6, 20266 min
 Trading
7% Rout Grips Brent Oil Prices as Trump Pauses Iran Strikes
Brent sank over 7% after Trump paused new Iran strikes, but Hormuz remains effectively closed and supply risk still hangs over crude.
Aug 3, 20266 min
 Trading
8% Wipeout Crushes WTI Crude Oil on Iran Deal Hopes
WTI crude oil slid nearly 8% as Iran deal hopes cut the war premium and dragged Hormuz risk back into focus.
Aug 3, 20266 min
 Trading
Strait of Hormuz Shutdown Lifts Oil Prices 6%
WTI crude oil jumped over 6% after Iran confirmed talks on shipping routes don't mean the Strait of Hormuz will reopen, setting the stage for a prolonged geopol
Aug 10, 20268 min
 Trading
Gold's Lockstep Surge Hints at Dollar Replay
Gold is rallying alongside oil, breaking its traditional inverse relationship. This reveals a market shift—bullion is pricing a tangible inflation premium from
Aug 6, 20266 min
 Global Trends
Trump Flees Bombers in an Airport Galley Truck
Faced with a credible Iranian threat, Donald Trump was secretly transferred from Air Force One via a catering truck and decoy flight, revealing a new era of pre
Aug 11, 20267 min
 Global Trends
Trump Evaded Iranian Missile Via Airport Catering Truck
President Trump was secretly transferred from Air Force One to a smaller military jet via an airport catering truck to evade a credible Iranian missile threat a
Aug 11, 20266 min
 Technology
Drone Strike Ignites 4.5-Million-Liter Gasoline Tank in Libya
Coordinated drone strikes ignited Libya's largest refinery, a targeted blow to the nation's oil lifeline that signals a new phase of economic warfare amid fragi
Aug 11, 20268 min
 Global Trends
Prison System Nears 'Total Gridlock' With 86,500 Inmates
England's prisons hold 86,500 inmates in a system designed for 70,000, creating a political firestorm over early release schemes that masks a fundamental breakd
Aug 12, 20266 min
 Trading
German Energy Shock Traps ECB in High-Inflation Loop
A sharp jump in German inflation, driven by soaring energy costs, forced markets to refocus on the ECB's domestic price problem over geopolitical risk.
Aug 12, 20265 min
Don't miss the signal
Get our weekly roundup of the stories that matter across tech, fintech, and trading. No noise, just signal.
Free forever. No spam. Unsubscribe anytime.