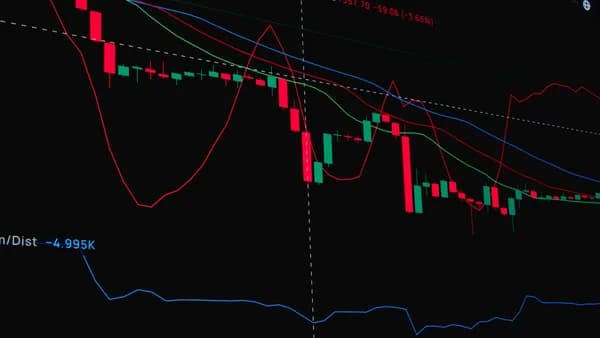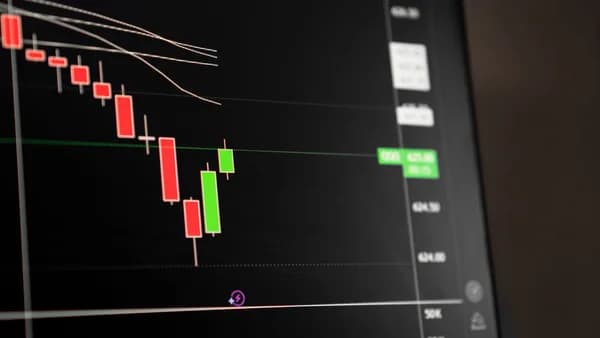
If the WTI price forecast is really bullish, why is the market still one break below $67 away from reopening the downside risk?
XOOMAR Intelligence
Analyst Take
West Texas Intermediate, futures on NYMEX, traded 1% higher near $69.40 during Tuesday’s European session, according to FXStreet. That sounds supportive for oil. The chart says something colder: the rebound has not yet changed the near-term bearish structure, and the source’s main warning remains tied to a break below the broad $67 area.
The primary signal is not the bounce. It’s the floor.
Why does a 1% WTI bounce still leave sellers in control?
WTI’s move to around $69.40 looks more like a tactical rebound than a bullish reversal because the price has not yet shown that buyers have regained control. FXStreet’s technical framing keeps the focus on whether crude can avoid a break below the broad $67 threshold.
That gap between a one-session rise and a confirmed trend shift matters. A market can rise for a session and still remain technically weak if it can’t follow through. Here, the latest gain has not erased the bearish bias.
Iran strikes and oil-shock risks can quickly affect crude, but the supplied source material does not establish a specific ship-attack catalyst for this move. That makes it safer to treat the 1% rise as a contained bounce rather than proof that traders are pricing a major supply shock.
Yet the rally stayed limited. The key tension in this WTI price forecast is simple: oil rose, but not enough to remove the downside risk identified around $67.
Is $67 the real line between range trading and a faster slide?
Yes. FXStreet’s headline frames $67 as the level below which more downside is likely.
That makes $67 more than a nearby support area. It is the chart’s stress point. Above it, WTI can still chop between support and resistance. Below it, the forecast shifts from weak but contained to vulnerable to a deeper move.
The levels are clean:
| WTI level | Source-based role |
|---|---|
| $69.40 | Approximate Tuesday trading area after the 1% rise |
| $67 | Broad downside threshold highlighted by FXStreet |
XOOMAR analysis: the market is compressing between a weak bounce and a clearly defined breakdown point. That kind of setup can punish traders who chase headlines without checking whether price has actually cleared resistance.
For readers tracking similar technical pressure points across markets, our recent coverage of WTI bulls being tested near a key moving-average zone offers useful chart context. The lesson is the same: a technical barrier can turn a headline rally into a failed rebound if buyers don’t follow through.
What do momentum signals say beneath the Hormuz headline?
The momentum picture still favors caution.
The source’s broad technical framing points to downside risk if WTI breaks below $67. That does not mean oil must fall in a straight line. It means the bounce near $69.40 still needs confirmation before it can be treated as a durable reversal.
That nuance matters. A stretched market can produce short-covering or headline-driven bounces. But unless those bounces push through resistance and hold, they remain vulnerable.
The first test is follow-through. If WTI keeps stalling after a modest rise, buyers are not building conviction. A stronger signal would be a sustained move that challenges the bearish near-term bias rather than simply reacting to short-term news.
For now, the WTI price forecast remains asymmetric. The market has resistance overhead and a clearly defined downside trigger beneath it.
How much of this move is geopolitics, and how much is supply pressure?
Geopolitical concern may have given oil a reason to bounce. Supply expectations still give traders a reason to stay cautious.
The provided context supports the broader point that OPEC+ production decisions can influence oil prices by changing supply expectations. However, the supplied material does not establish that a fresh output hike was announced in this case. So the defensible point is narrower: the supply backdrop remains relevant, but the current article’s core signal is still the technical risk around $67.
That matters because price action suggests the market is not yet pricing a major supply shock. If it were, WTI would likely be pushing higher more forcefully instead of hovering near $69.40.
XOOMAR analysis: this is a split market. Headline risk can be bullish. Technical pressure is still bearish. Until one side overwhelms the other, $67 and the area around $69.40 will do most of the talking.
Which hard data can validate or break the WTI rebound?
The source’s market framework points to inventories as the next type of hard evidence that can test the rebound.
Weekly oil inventory reports from the American Petroleum Institute and the Energy Information Administration show changes in stored crude levels. A draw can signal stronger demand and support prices. A build can point to excess supply and pressure prices. FXStreet’s FAQ section notes that API data is published every Tuesday, while EIA data follows the next day, and that EIA figures are generally considered more reliable because it is a government agency.
That matters here because WTI is not trading from a position of strength. It is trading near $69.40, with $67 close enough to become the next test if sentiment weakens.
The US Dollar is another variable flagged by the source’s framework. Since crude is predominantly traded in dollars, a weaker dollar can make oil more affordable for non-US buyers, while a stronger dollar can do the opposite. The source does not provide a current dollar reading, so this remains a framework point rather than a claim about Tuesday’s move.
A related macro angle appears in our coverage of how an oil shock can complicate Bitcoin inflation narratives. Different asset classes react differently, but the common thread is simple: oil can shift risk pricing when the move is large enough and persistent enough.
Who has the most to lose if WTI breaks $67?
For active crude traders, the answer is straightforward: anyone positioned for a bullish breakout without confirmation from price.
A break below $67 would support FXStreet’s bearish extension scenario and leave lower levels exposed. That does not guarantee a straight-line move, but it would change the character of the chart. Support would have failed. Sellers would have a cleaner technical case.
Oil bulls need the opposite. They need WTI to sustain its rebound and reclaim higher technical ground. Without that, the rally remains suspect.
For OPEC+, the issue is different. Production policy can shape supply expectations and influence crude prices, but the supplied material does not confirm a current output increase. If WTI weakens further, the market will be testing whether supply concerns, demand signals, or disruption risk are driving the next move.
For consumers and businesses, lower crude can eventually ease fuel-cost pressure, but the source does not provide retail fuel data, refining margins, or regional pricing. So the only defensible point is narrower: cheaper crude, if sustained, changes the input-price conversation. Whether it reaches end users depends on factors not covered in the source.
Can bulls regain control without a move above $70?
Not convincingly.
The immediate WTI price forecast is simple: around $69.40, bulls are still proving their case. Below $67, sellers get a stronger one. A sustained move higher would be needed to make the bearish near-term bias harder to defend.
The next sessions should be judged by evidence, not drama. A fresh geopolitical escalation, a clear change in supply expectations, or inventory data showing tighter supply could help buyers. A break below $67, broader supply pressure, or weak inventory signals would weaken the rebound.
For now, the market has delivered a warning rather than a reversal. WTI bounced, but the chart still says oil has not escaped the downside threat.
Disclaimer: This XOOMAR analysis is for informational and educational purposes only. It is not financial, investment, legal, tax, or professional advice. It does not provide buy, sell, hold, price-target, portfolio, or personalized recommendations. Verify information independently and consult qualified professionals before making decisions.
The Bottom Line
- WTI’s 1% bounce has not yet overturned the near-term bearish setup.
- A break below $67 could reopen further downside risk for crude prices.
- The market remains focused on technical support rather than a confirmed bullish reversal.
WTI Price vs Key Downside Threshold
Primary Sources & Disclosures
Disclaimer: Content on XOOMAR is produced using AI-assisted research, drafting, and verification workflows and is intended for informational and educational purposes only. It does not constitute financial, investment, legal, tax, medical, or professional advice of any kind. All analysis reflects available information at the time of publication and may not be current. Verify information independently and consult qualified professionals before making decisions. Editorial policy

Written by
XOOMAR Insights Team
Research and Editorial Desk
The XOOMAR Insights Team pairs automated research with human editorial judgment. We track hundreds of sources across technology, fintech, trading, SaaS, and cybersecurity, cross-check the facts, and explain what happened, why it matters, and what to watch next. We do not just rewrite headlines. Every article is fact-checked and scored for reliability before it goes live, and we link back to the original sources so you can verify anything yourself.