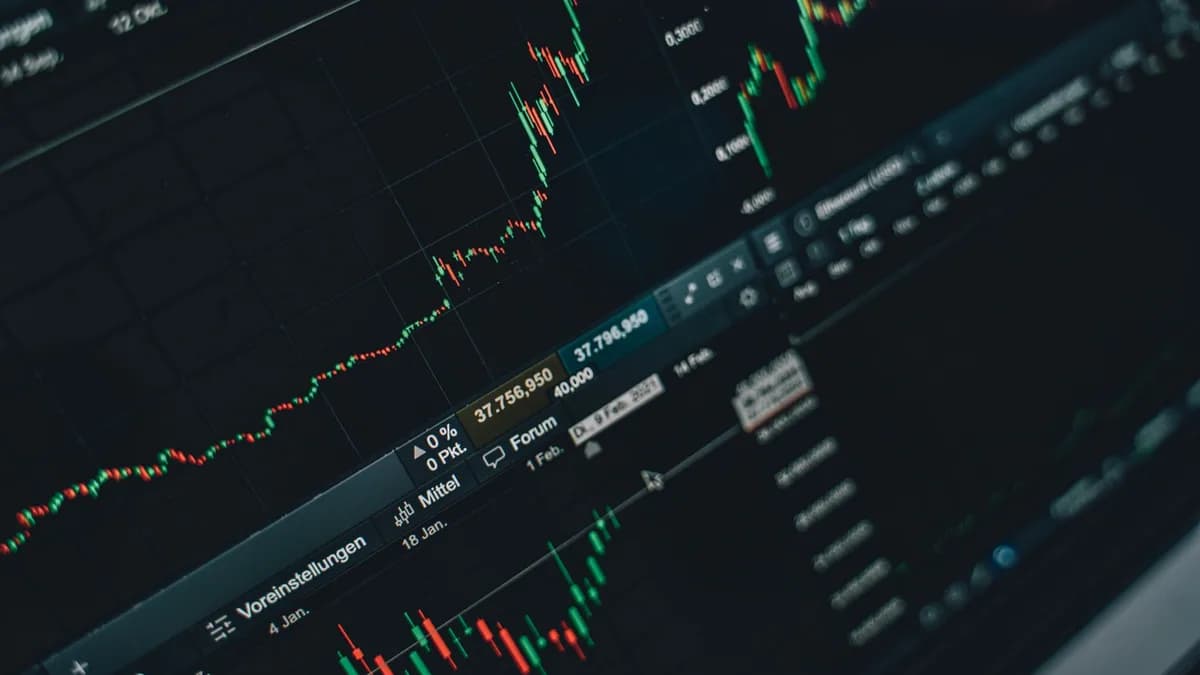
For newcomers to the markets, navigating the world of technical analysis can feel overwhelming. However, one of the most encouraging developments is the sheer quality of free stock charting software now available, which allows beginners to learn, practice, and analyze without any initial investment. By understanding what to look for and choosing the right platform for your needs, you can build a solid foundation in market analysis. This guide, grounded in detailed 2026 reviews and comparisons, will walk you through the top free charting tools, their ideal use cases, and how to get the most out of them as you start your journey.
What Beginners Should Look For in Free Charting Tools
Starting with the right tool can make learning technical analysis more engaging and less frustrating. According to experts testing these platforms in 2026, beginners should prioritize a few key aspects grounded in real user experience.
Clear and Customizable Interface: A clean, intuitive layout is crucial. Platforms like TradingView are praised for their "clean, easy to customize" charts, which prevent new users from feeling lost. Conversely, some powerful platforms have a steeper learning curve that might be daunting at first.
Educational Value and Guidance: Some free tools are better teachers than others. Look for platforms that offer built-in learning resources or a community. StockCharts.com is repeatedly highlighted for its "excellent educational content" through its ChartSchool section, making it a strong choice for those wanting to learn the why behind patterns and indicators.
Realistic Feature Limitations: All free tiers have limits. A critical factor is whether those limits hinder the learning process. Beginners should note if a platform restricts the number of charts or indicators per chart on its free plan. For example, the free version of TradingView allows only "one chart per window and apply up to two indicators per chart," which may be sufficient for initial exploration but restrictive for more complex analysis.
"It's hard to do great analysis with lousy charts. In my testing, I focused on design, ease of use, technical tools, and customizability. I wanted to see which of the best free stock charts offered institutional-grade features without the institutional price tag.", Managing Partner of StockBrokers.com
Data Quality and Speed: Confirm whether the price data is real-time or delayed. For practice and swing trading, delays of a few minutes may be acceptable. However, as noted in reviews, FinViz’s free plan data is "delayed by up to five minutes," and Trade1 offers only "end-of-day data," making them unsuitable for practicing fast-paced day trading but fine for longer-term analysis.
TradingView (Free Plan): The Community Standard
Universally recognized as a leader, TradingView sets the benchmark for modern, cloud-based charting. Its free plan is incredibly capable, though designed to showcase the value of its paid tiers.
Key Strengths for Beginners:
- Rich Feature Set: The platform offers "clean charts with 15 chart types available" and supports "indicators on indicators," a unique feature for deeper analysis. It also includes automated candlestick pattern recognition and Fibonacci retracement plotting.
- Active Community and Learning: Perhaps its biggest asset for a novice is the social community. Users share trade ideas, scripts, and forecasts, creating a live learning environment. You can also copy "community-contributed indicators" onto your own charts.
- Practice Tools: A research lead highlights TradingView's "Bar Replay" feature as "a hidden gem for practicing technical analysis," allowing you to replay market action candle by candle to test your reading skills without risk.
Notable Free Tier Limitations:
- Feature Caps: As mentioned, you are limited to one chart per tab and a maximum of "two indicators per chart" (some sources note three; the consensus is a low number). You also get only "one alert on indicators and chart annotations."
- Ad-Supported: The free experience includes ads and "frequent upgrade prompts."
Bottom Line for Beginners: TradingView's free plan is ideal for beginners who want to learn on a professional-grade platform and benefit from a massive community. Its limitations gently push you to focus on core concepts before layering on complexity.
Webull Desktop and Mobile: Broker-Integrated Charts
Webull is primarily a commission-free brokerage, but its integrated charting tools are robust enough to be considered a standalone benefit, especially for those who eventually want to trade from the same platform.
Key Strengths for Beginners:
- All-in-One Experience: It combines "commission-free trading on stocks, options, and cryptocurrencies" with "advanced technical charts." This integration allows you to analyze and act within one ecosystem.
- Excellent Mobile Experience: Consistently rated highly for mobile use, the Webull app offers a "clean, user-friendly mobile interface that doesn’t feel crowded." You can switch between simple order screens and full charts easily.
- Real-Time Data: Unlike many pure charting websites, Webull provides free real-time data for US stocks with no mandatory paid tier, which is a significant advantage for practicing with live prices.
Considerations:
- Account Required: Access requires opening a brokerage account, which involves standard identity verification (KYC). It's "not available in all countries."
- Charting is Secondary: While its charts are "decent," they are not as specialized or expansive as a dedicated platform like TradingView. There is "no custom indicators" or automated buy/sell signal generation.
Bottom Line for Beginners: Webull is perfect for the beginner who knows they want to start trading soon and values a seamless transition from paper trading or analysis to live execution, all with high-quality real-time charts on desktop and mobile.
Yahoo Finance Charting: Simple and Accessible
A household name, Yahoo Finance offers a no-fuss charting experience deeply integrated with news and fundamental data.
Key Strengths for Beginners:
- Zero Barrier to Entry: You can access basic charts with "no account needed." Simply navigate to the site and enter a ticker.
- Fundamental Context: The platform "excels at financial news, earnings data, and fundamental analysis." This allows beginners to look at the bigger picture, connecting price movements to news events, financial statements, and analyst estimates.
- Clean and Functional: The charts are described as "clean HTML5 charts that are clear [and] easy to use," ideal for everyday investors making their first foray into price visualization.
Limitations for Technical Analysis:
- Basic Charting Tools: Charts are "secondary to the news experience." The free tier has "limited technical indicators" and is not designed for advanced technical work.
- Ad-Heavy: The free experience includes advertisements.
Bottom Line for Beginners: Yahoo Finance is best for the absolute beginner or an investor who prioritizes news and fundamentals alongside simple trend visualization. It's a starting point for understanding how markets react to information.
Freestockcharts.com (TradingView Light)
This platform is essentially a streamlined, standalone version of TradingView charts. While not deeply detailed in the core sources, it is recognized as a legitimate free option. It typically offers core TradingView charting technology with fewer social and community features, potentially providing a less cluttered environment for focused learning. Beginners should be aware that, like the direct TradingView free tier, it will likely have similar limitations on indicators and be supported by advertisements. It serves as a viable alternative for those who want the TradingView engine without the full platform ecosystem.
Broker-Provided Free Tools (Thinkorswim PaperMoney, etc.)
Some brokerages offer exceptionally powerful platforms for free upon opening an account. The standout example is Thinkorswim by Charles Schwab.
Key Strengths for Beginners:
- Professional-Grade Power: Thinkorswim is described as "one of the most powerful trading platforms available, and it’s completely free." It includes a vast array of indicators, the ability to create custom ones with ThinkScript, and Level II data.
- Unmatched Practice Environment: Its PaperMoney feature provides a realistic simulated trading account. Crucially, experts note it offers "backtesting for custom strategies," adding, "We haven’t found another trading software that provides advanced strategy backtesting tools for free."
- Integrated Learning: The depth of tools allows a beginner to grow into advanced concepts without switching platforms.
Consideration:
- Brokerage Account Required: Like Webull, you need to open a Schwab account, though there is "no minimum deposit and no trading requirements."
Bottom Line for Beginners: Thinkorswim is the ultimate free toolkit for the serious beginner who is committed to deep study. It’s overwhelming at first but provides a runway to support your development from novice to advanced trader all within one free platform.
Limitations of Free Tiers: Data Delays, Indicator Caps
It's essential to enter the world of free stock charting software with realistic expectations. The limitations are consistent across most platforms and are designed to incentivize upgrades.
Data Delays: This is a critical limitation for active trading practice. Multiple sources confirm:
- FinViz: "Data is delayed by up to five minutes" (free plan).
- Trade1: Provides "end-of-day data only (not real-time)."
- General Note: As one FAQ states, "some platforms delay data by 5-10 minutes, which can be a problem for day trading."
Feature and Usage Restrictions:
- Indicator Limits: TradingView's free plan caps indicators at 2-3 per chart. Other platforms may offer more indicators but restrict other features.
- Alert Limits: TradingView's free tier allows only one alert.
- Chart Layouts: Advanced multi-chart layouts for comparing assets are typically a paid feature.
- Advertisements: The free experience on TradingView, FinViz, and Yahoo Finance is "ad-supported," which can be distracting.
Saved Workspaces and Historical Data: Many free tiers do not allow you to save custom chart setups or access extensive historical data, limiting your ability to build a persistent analysis routine.
Learning Path: Practicing Technical Analysis on These Platforms
A structured approach can maximize the value of these free tools.
1. Start with Price Action: Use a simple platform like Yahoo Finance or Google Finance to observe basic line charts and understand support/resistance, trends, and volume. Google Finance is noted for being an "instant access" tool for quick price checks.
2. Introduce Basic Indicators: Graduate to a platform like TradingView or Webull. Start with one or two of the most common indicators, like Simple Moving Averages (SMA) or the Relative Strength Index (RSI), staying within the free tier limits. Practice identifying crossovers and overbought/oversold conditions.
3. Practice Without Risk:
- Use Thinkorswim’s PaperMoney to test trade ideas with virtual money.
- Use TradingView’s Bar Replay mode to historically test your chart reading skills.
4. Engage with the Community: On TradingView, follow other users' published ideas to see how they apply analysis. On StockCharts.com, utilize the "excellent educational content" in ChartSchool to understand the theory.
5. Screen for Opportunities: Use a dedicated free screener like FinViz ("70+ technical and fundamental screening metrics") to find stocks matching basic criteria, then analyze them in your chosen charting tool.
When to Consider Upgrading to a Paid Plan
The free tools are powerful, but your growth may eventually necessitate an upgrade. Consider a paid plan if you consistently encounter these walls:
- You Need More Indicators: If your strategy requires combining 4 or 5 indicators simultaneously and you're constantly removing one to add another on TradingView's free plan.
- Real-Time Data is Essential: If you progress to more active trading strategies and the 5-15 minute data delay on free screeners or chart websites hampers your practice.
- You Rely on Alerts: If you want to set multiple, non-expiring price or indicator alerts to monitor opportunities.
- Advanced Features Call: If you want to use multi-chart layouts, backtest custom strategies (beyond PaperMoney), or access deeper historical data.
Paid tiers start at relatively low costs. For example, TradingView's Essential plan is $14.95/month, and Thinkorswim remains free with a brokerage account.
Comparison Table: Features, Limits, and Best Use Cases
The table below summarizes the key free tier attributes of the top platforms, based on the aggregated 2026 review data.
| Tool / Platform | Free Tier Data | Key Free Tier Limits | Best For Beginners Because... |
|---|---|---|---|
| TradingView | Varies; real-time for some, delayed for others. | 1 chart/tab; 2-3 indicators/chart; 1 alert; ads. | Unmatched community, professional tools, and practice features like Bar Replay. |
| Webull | Real-time (US stocks). | Requires brokerage account (KYC); charting is secondary to trading. | Seamless integration of real-time charts with a trading account; top-tier mobile app. |
| Thinkorswim | Real-time (with Schwab account). | Requires brokerage account; complex interface. | Most powerful free toolkit, including PaperMoney simulation and custom strategy backtesting. |
| Yahoo Finance | Real-time. | Basic charts; limited indicators; ad-heavy. | Perfect for connecting price action to news and fundamental data with zero signup. |
| FinViz | Delayed 5-15 mins. | Charts are static images; delayed data; ad-heavy. | Excellent free stock screener to find potential trades for further chart analysis elsewhere. |
| StockCharts.com | Delayed. | Very limited free charting. | World-class educational content (ChartSchool) for learning technical analysis theory. |
| Trade1 | End-of-day only. | US stocks only; 4 fixed indicators; no alerts. | Instant, no-signup charts with automated signals; good for very quick, simple analysis. |
FAQ
What is the best completely free stock charting software for a total beginner? For a total beginner who wants an easy start with no account required, Yahoo Finance offers clean, basic charts integrated with excellent news and fundamental data. If you're willing to sign up for a free account, TradingView's community and learning resources provide a richer long-term learning path.
Can I practice trading for free with these charting tools? Yes. Thinkorswim's PaperMoney is specifically designed for risk-free simulated trading and includes advanced features like backtesting. TradingView's Bar Replay also lets you practice reading charts on historical data. Note that these are for practice and analysis, not for live trading without capital.
Do any free charting platforms offer real-time data? Yes, but often with conditions. Webull and Thinkorswim provide real-time data for free when you open a brokerage account. Some platforms like TradingView offer real-time data only on specific exchanges or in their paid plans. Always check the data terms of the free tier.
Is free charting software good enough to actually trade with? According to the research, many free tools are "worthwhile" and offer "advanced features with relatively few limitations." For beginners and many retail traders, free tiers provide all the necessary tools for analysis. The decision to upgrade depends on your specific strategy needs, such as the number of indicators, alerts, or real-time data requirements.
What's the main downside of using free charting tools? The three most common downsides are: 1) Delayed data on many platforms (5-20 minutes), 2) Restricted features like a low cap on indicators or alerts, and 3) Advertisements that can clutter the interface. These are trade-offs for having access to powerful tools at no cost.
Bottom Line
The landscape of free stock charting software in 2026 is robust, offering beginners legitimate professional-grade tools to start their technical analysis journey at no cost. Your choice depends on your goals: choose TradingView for its community and comprehensive features, Webull or Thinkorswim for integrated real-time trading practice, Yahoo Finance for fundamental context, or FinViz for powerful screening. Start with one that matches your immediate learning style, take advantage of paper trading features to practice risk-free, and upgrade only when the platform's limits actively hinder your developed strategy. The resources available today mean there has never been a better time to start learning market analysis.