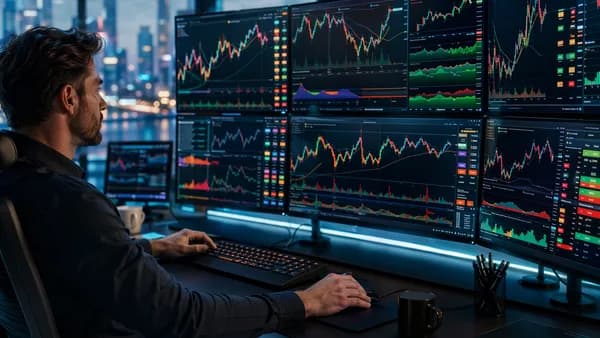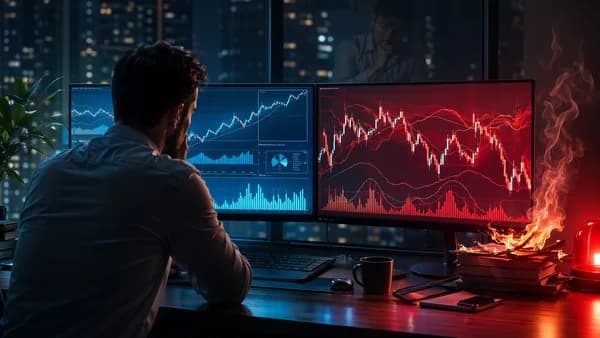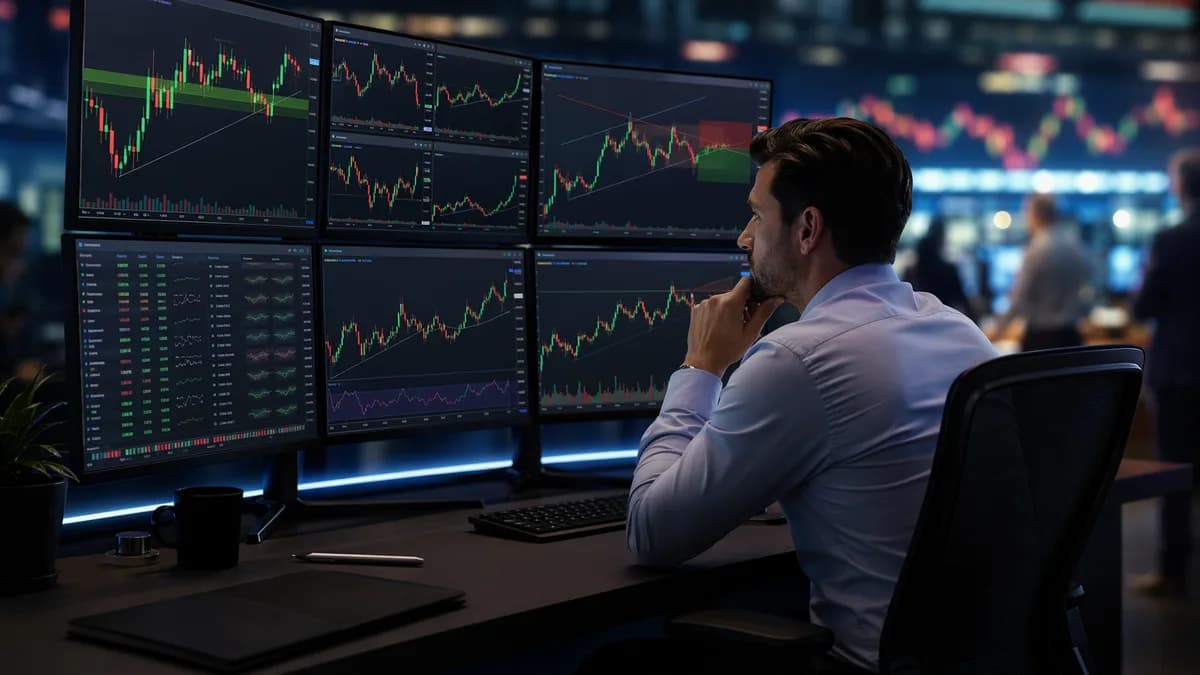
A good technical analysis software workflow should reduce decisions, not add more screens, alerts, and conflicting signals. The goal is to move from “checking everything” to a repeatable process for finding, validating, tracking, and reviewing trades using a small set of tools.
Research from TradeAlgo notes that 78% of active traders rely on chart-based strategies for at least half their trades, which explains why charting platforms, scanners, alerts, and journals can quickly pile up. The problem is not that traders lack software; it is that many lack a defined workflow for using it.
Why Traders Need a Defined Software Workflow
A technical analysis workflow is the sequence you follow from idea generation to post-trade review. Without that sequence, software becomes a source of distraction: one platform for charts, another for alerts, another for scanning, another for options flow, and another for journaling.
A useful workflow answers five questions:
- Find: How do you discover potential trades?
- Validate: What chart, indicator, or confirmation rules must be true?
- Track: Where do active ideas live before entry?
- Execute/Monitor: What alerts tell you to act or stand aside?
- Review: How do you study what worked and what failed?
Key principle: Your workflow should make the next action obvious. If every setup requires opening five platforms and rethinking your rules, the workflow is too complex.
The idea is similar to a technical flow chart. ConceptDraw describes technical flowcharts as visual representations that break complex processes into individual components, helping users identify bottlenecks, redundancies, and inconsistencies. That same concept applies directly to trading.
A simple trading workflow can be mapped like this:
Start
  ↓
Run stock screen
  ↓
Does the chart match a known setup?
  ├─ No → Ignore or archive
  └─ Yes
       ↓
Add to setup-specific watchlist
       ↓
Set price/condition alert
       ↓
Alert triggers
       ↓
Re-check entry rules
       ├─ Rules fail → Remove or reset alert
       └─ Rules pass → Trade plan created
            ↓
Journal trade with screenshot
            ↓
Review outcome weekly
End
ConceptDraw recommends keeping flowcharts simple, ideally under 20 steps, and breaking complex processes into smaller sub-processes. That is a useful constraint for traders: if your process has too many steps to fit on one page, it may be too complicated to execute consistently.
Step 1: Choose One Primary Charting Platform
The first step in building a technical analysis software workflow is choosing one primary charting platform. This is where you perform your main chart review, draw levels, check indicators, compare time frames, and validate setups.
You can still use other tools, but one platform should be the “source of truth” for chart analysis.
Compare charting platforms by workflow role
The research data shows that leading platforms differ meaningfully. Some are strongest for pure technical analysis, some for automated pattern work, some for scan speed, and some for fundamental overlays.
| Platform | Best Workflow Role | Notable Source-Backed Features | Starting Price Mentioned | Free Tier / Trial |
|---|---|---|---|---|
| TradingView | Primary charting and community ideas | 400+ built-in indicators, Pine Script, 60M+ users, 100K+ shared scripts | $14.95/mo Essential | Yes |
| TrendSpider | Automated technical analysis | Automated trendlines, 50+ chart patterns, multi-timeframe confluence, Raindrop charts | $32.50/mo billed annually in TradeAlgo; $49.95/mo Essential in DayTradingZ | Trial mentioned |
| TC2000 | U.S. stock scanning and clean charts | 70+ indicators, EasyScan, sub-1-second scan results in TradeAlgo testing | $9.99/mo | Trial mentioned in TradeAlgo |
| Thinkorswim | Free charting with scripting | 300+ indicators, thinkScript, backtesting, basic options flow | Free | Yes |
| NinjaTrader | Charting and futures-oriented workflow | 100+ indicators, C# customization, backtesting | Free charting | Yes |
| StockCharts | Traditional charting | 70+ indicators, limited backtesting | $24.95/mo | Trial mentioned |
| Koyfin | Technical + fundamental context | Technical indicators plus financial data visualization and screening | $39/mo Pro | Free tier |
| ProRealTime | European markets and professional charting | Technical indicators, drawing tools, backtesting, market replay, automated trading | From €29.95/mo for real time | Free end-of-day version |
How to choose without overcomplicating
Use the platform’s strength to match your strategy, not your curiosity.
- TradingView: Choose it if your workflow depends on broad chart coverage, custom indicators, community scripts, and multi-asset charts. TradeAlgo identifies it as best overall for pure technical analysis, with 400+ indicators and Pine Script customization.
- TrendSpider: Choose it if you spend too much time drawing trendlines, marking patterns, or checking multiple time frames manually. Source data highlights automated trendline detection, pattern recognition, and multi-timeframe confluence.
- TC2000: Choose it if your workflow is focused on U.S. stocks and fast condition-based screening. TradeAlgo reported TC2000 scan results under 0.8 seconds for multi-condition scans across U.S. equities.
- Koyfin: Choose it if longer-term trade ideas require both technical and fundamental filters, such as price above the 200-day moving average plus valuation metrics.
- ProRealTime: Choose it if you need strong European market coverage, end-of-day access, or professional tools such as market replay and automated trading.
Workflow warning: Do not choose a platform because it has the most features. Choose the one where you can complete your chart review the same way every time.
For most traders, the practical rule is simple: one charting home, one screening process, one alert system, and one journal.
Step 2: Build a Repeatable Stock Screening Process
Screening is where many workflows become noisy. Traders often run too many scans, change filters daily, and chase whatever produces the biggest list.
A better process starts with a small number of repeatable screens tied to specific setups.
Use the same scan logic every session
TradeAlgo tested scanning platforms using identical conditions:
- RSI below 30
- Volume above 1M
- Price above 200-day SMA
That example is useful because it combines momentum, liquidity, and trend context. It also shows how a scan should be built: each condition should answer a specific question.
| Scan Condition | What It Helps Filter |
|---|---|
| RSI below 30 | Potentially oversold stocks |
| Volume above 1M | More liquid names |
| Price above 200-day SMA | Stocks still above a long-term trend reference |
You do not need to use that exact scan. The point is to define conditions before the market starts moving.
Match the scanner to the asset and setup
The source data highlights different scanner strengths:
- TC2000: Strong for U.S. stock scanning. TradeAlgo found it returned multi-condition scans across all U.S. equities in under 0.8 seconds. DayTradingZ notes that EasyScan includes pre-built scans for common technical analysis setups.
- TradingView: Useful for broad charting and multi-asset coverage, including global stocks, forex, futures, and cryptocurrencies, according to DayTradingZ.
- TrendSpider: Useful when the screening process depends on automated patterns, trendlines, and multi-timeframe analysis.
- Koyfin: Useful when screens combine technical and fundamental criteria, such as “P/E ratio under 15 AND price above 200-day moving averages,” as described in the source data.
- Trade Ideas: Mentioned as strong for day trading and real-time market scanning, with pricing starting at $84/month in the DayTradingZ source.
Keep your scans setup-specific
Instead of one giant scan, create a small set of focused scans:
- Pullback scan: Finds stocks near moving averages or support zones.
- Breakout scan: Finds stocks near highs with volume conditions.
- Mean reversion scan: Finds oversold stocks using indicators such as RSI.
- Trend continuation scan: Finds stocks above long-term moving averages.
The sources do not prescribe exact formulas for each setup, so the key is not the specific indicator combination. The key is consistency: run the same scan, at the same time, and evaluate results using the same chart rules.
Step 3: Use Alerts Instead of Constantly Watching Charts
Alerts are one of the simplest ways to reduce overtrading. Instead of staring at charts and reacting to every candle, alerts let software tell you when a predefined condition matters.
DayTradingZ lists alerts as an essential feature of technical analysis software, specifically “set alerts for key price levels.” TradeAlgo also notes that TradingView has alert limits on lower-tier plans, which matters when choosing a plan.
What alerts should do in your workflow
Alerts should not replace analysis. They should trigger a review.
Use alerts for:
- Price Levels: A stock reaches support, resistance, breakout, or pullback zones.
- Technical Conditions: A moving average crossover, RSI condition, or volume trigger, depending on platform support.
- Pattern Events: TrendSpider’s dynamic price alerts can trigger based on complex setups, according to DayTradingZ.
- Multi-Asset Monitoring: TradingView alerts work on mobile devices, which helps traders monitor ideas without staying at the desk.
Critical warning: If every small move triggers an alert, alerts become noise. Only set alerts where you would genuinely consider making a decision.
Alert workflow example
Watchlist stock reaches planned level
  ↓
Alert triggers
  ↓
Open primary charting platform
  ↓
Check setup rules
  ↓
Check broader market or sector context if part of your plan
  ↓
Either create trade plan or dismiss alert
Do not use alerts to justify impulsive trades. Use them to avoid watching charts constantly.
Step 4: Create Watchlists for Different Trade Setups
A watchlist should not be a random collection of interesting tickers. It should organize trade candidates by setup type and readiness.
This matters because the same stock can look appealing for different reasons. Without categories, traders may mix breakout ideas, pullback ideas, oversold bounces, and long-term trend ideas into one list and lose clarity.
Build watchlists around decisions
Use separate watchlists such as:
| Watchlist | Purpose | Typical Next Action |
|---|---|---|
| Breakout Candidates | Stocks near resistance or prior highs | Set breakout alert |
| Pullback Candidates | Stocks approaching moving average or support area | Wait for confirmation |
| Oversold Candidates | Stocks meeting conditions such as low RSI | Watch for reversal setup |
| Earnings / News Watch | Stocks requiring extra caution or context | Review before acting |
| Post-Trade Review | Completed trades to revisit | Screenshot and journal review |
TradingView, TC2000, TrendSpider, Koyfin, and ProRealTime all appear in the source data as platforms with charting or screening capabilities, but the sources do not provide detailed watchlist feature comparisons for each. So the evergreen principle is platform-neutral: organize by setup, not by excitement.
Keep watchlists small enough to act on
A watchlist that contains hundreds of names can create the illusion of preparation while making execution harder. Borrow the flowchart principle from ConceptDraw: simplify the process, identify bottlenecks, and avoid unnecessary complexity.
A practical rule is to ask:
- Setup: Why is this ticker here?
- Trigger: What price or condition matters?
- Invalidation: What would remove it from the list?
- Review Date: When will I check it again?
If you cannot answer those questions, the ticker probably does not belong on an active trading watchlist.
Step 5: Connect Trade Journaling to Your Analysis Process
A journal is most useful when it connects directly to the analysis that led to the trade. Many traders journal only the outcome: profit, loss, entry, exit. That misses the most important workflow question: did the trade match the setup?
Your journal should capture both the decision and the evidence.
What to journal for a technical setup
At minimum, record:
- Setup Type: Breakout, pullback, reversal, trend continuation, or another defined setup.
- Chart Context: Time frame used, trend condition, key support/resistance.
- Indicators Used: Moving averages, RSI, volume, or other tools that are part of your rules.
- Trigger: The price level or condition that caused action.
- Screenshot: Chart at entry and, ideally, chart at exit.
- Rule Compliance: Whether the trade followed the workflow.
- Outcome: Win, loss, breakeven, or skipped trade.
The source data emphasizes that strong technical analysis platforms provide multiple time frames, indicators, drawing tools, historical data, real-time data, custom indicators, and alerts. Your journal should document which of those tools actually influenced the trade.
Best practice: If a chart condition was important enough to enter a trade, it is important enough to screenshot and review later.
Avoid journaling as an afterthought
Trade journaling should happen at two points:
- Before or at entry: Capture the planned setup and chart.
- After exit: Capture the result and updated chart.
That keeps the journal tied to the original analysis, instead of becoming a memory-based explanation after the fact.
Step 6: Review Losing and Winning Setups With Screenshots
The best reason to build a technical analysis software workflow is not just cleaner execution. It is better review.
Screenshots let you compare what you believed at entry with what the chart actually showed. Over time, that can reveal whether your best trades share common traits or whether your losses come from repeating avoidable mistakes.
Review both winners and losers
Many traders review losses but ignore winners. That creates an incomplete picture.
Review:
- Winning Trades: Did they follow the rules, or were they lucky deviations?
- Losing Trades: Did they fail because the setup was poor, the timing was early, or the market changed?
- Skipped Trades: Did alerts fire but the setup fail confirmation?
- Watchlist Removals: Did the stock invalidate before entry?
Use screenshots to reduce hindsight bias
A screenshot-based review should include:
| Screenshot | Why It Matters |
|---|---|
| Initial scan result | Shows why the stock entered your workflow |
| Pre-entry chart | Captures setup quality before the outcome was known |
| Entry chart | Documents the actual trigger |
| Exit chart | Shows whether the exit matched the plan |
| Post-trade chart | Helps evaluate whether the setup continued, failed, or reversed |
Platforms such as TradingView, TrendSpider, TC2000, Koyfin, and ProRealTime provide charting environments, but the sources do not specify detailed screenshot workflows. The actionable point is to use whichever charting platform is your primary analysis tool and keep images attached to your journal process.
Weekly review questions
Ask the same questions every week:
- Which setup produced the clearest trades?
- Which setup produced the most confusion?
- Which alerts were useful, and which were noise?
- Which watchlists became cluttered?
- Did trades match the scan that found them?
- Did the primary charting platform provide enough information, or did you keep jumping tools?
If you repeatedly need extra tools to validate the same setup, you may need to redesign that setup—or choose a platform better suited to it.
Common Workflow Mistakes That Lead to Overtrading
Overtrading often comes from unclear workflow design. The trader is not just taking too many trades; they are making too many unresolved decisions.
Mistake 1: Using too many charting platforms
Switching between multiple charting tools can create conflicting interpretations. One platform may emphasize automated patterns, another community scripts, another scan results, and another flow data.
The source data shows real differences:
| Platform Type | Strength | Risk If Misused |
|---|---|---|
| Pure charting platform | Deep indicators and drawing tools | Indicator overload |
| Automated analysis platform | Faster pattern and trendline detection | Outsourcing judgment |
| Scanner-first platform | Rapid idea generation | Too many low-quality candidates |
| Flow data tool | Options flow or dark pool context | Treating confirmation as a standalone signal |
| Fundamental + technical platform | Broader context | Mixing investment and trade criteria |
TradeAlgo notes that TradeAlgo fills a different gap by layering dark pool trading and options flow data on top of technical charts rather than competing on indicator depth. It also notes that only TradeAlgo and Thinkorswim offered flow visibility in its comparison.
That means flow tools may be useful for confirmation, but they should not replace a defined chart setup.
Mistake 2: Changing scans every day
If you change your scanner rules constantly, you cannot tell whether the setup works. You are just sampling the market.
Keep scan rules stable long enough to review outcomes.
Mistake 3: Treating alerts as trade signals
An alert should mean “review this,” not “enter now.” If the workflow skips validation after the alert, it encourages impulsive entries.
Mistake 4: Keeping one giant watchlist
A single list of unrelated tickers makes it hard to know what action is required. Split lists by setup type and remove invalidated ideas.
Mistake 5: Not reviewing screenshots
Without screenshots, reviews become story-based. With screenshots, you can see whether the trade matched your actual rules.
Mistake 6: Buying software before defining the process
The best platform depends on the workflow. TradeAlgo’s comparison shows that tools vary across indicator depth, customization, charting speed, scanning, backtesting, data integration, pricing, and education. A trader who needs fast U.S. equity scans may not need the same platform as a trader who needs automated trendline detection or global market coverage.
A Simple Daily and Weekly Technical Analysis Routine
A practical technical analysis software workflow should be simple enough to repeat. Below is a platform-neutral routine using the tool categories covered in the research: charting, screening, alerts, watchlists, and journaling.
Daily routine: 30–60 minutes outside active trade management
| Step | Action | Tool Category |
|---|---|---|
| 1 | Review broad market or primary trading universe | Primary charting platform |
| 2 | Run your predefined scans | Scanner |
| 3 | Open only the best scan results | Charting platform |
| 4 | Assign candidates to setup-specific watchlists | Watchlist |
| 5 | Set alerts at decision levels | Alert system |
| 6 | Journal any new trades with screenshots | Trade journal |
| 7 | Remove invalidated ideas | Watchlist cleanup |
Daily workflow in practice
Start with the same market view
Use your primary charting platform to check the time frames relevant to your strategy. DayTradingZ identifies multiple time frames as an essential feature of technical analysis software.Run only predefined scans
Do not browse endlessly. If using a scanner such as TC2000, TradingView, TrendSpider, Koyfin, or Trade Ideas, run scans that map to your actual setups.Validate on one charting platform
Check trend, levels, indicators, and pattern quality in one place. Avoid platform-hopping unless your workflow explicitly calls for confirmation from another data type.Move candidates into watchlists
Add only names that have a clear setup and trigger.Set alerts and step away
Alerts reduce the need to watch every candle.Journal trades immediately
Attach screenshots while the reasoning is fresh.
Weekly routine: review and simplify
Set aside time weekly to evaluate the workflow itself, not just trade outcomes.
| Weekly Review Area | Questions to Ask |
|---|---|
| Scans | Which scan produced the best candidates? Which produced clutter? |
| Charts | Did the primary platform provide enough clarity? |
| Alerts | Which alerts led to valid decisions? Which created noise? |
| Watchlists | Which lists became too crowded? |
| Journal | Did screenshots show rule-following or improvisation? |
| Software Stack | Is any tool duplicating another tool’s role? |
A simple one-page workflow
Following ConceptDraw’s guidance to keep flowcharts simple and readable, your workflow can fit into fewer than 20 steps:
1. Open primary charting platform
2. Review market context
3. Run predefined scan
4. Reject weak matches
5. Chart strong matches
6. Assign setup category
7. Add to matching watchlist
8. Set alert at decision level
9. Wait for alert
10. Re-check setup rules
11. Plan trade if rules pass
12. Take screenshot
13. Record trade in journal
14. Manage according to plan
15. Screenshot exit
16. Review trade weekly
17. Update scan/watchlist rules only if needed
That is the core of a sustainable technical analysis software workflow: fewer decisions, clearer triggers, and better feedback.
Bottom Line
A strong technical analysis software workflow does not require the most expensive or feature-heavy platform. It requires a defined sequence: screen, validate, watchlist, alert, journal, and review.
The source data shows that platforms have distinct strengths. TradingView leads for broad technical charting with 400+ indicators, Pine Script, and a large community. TrendSpider is strongest for automated chart analysis, trendlines, patterns, and multi-timeframe confluence. TC2000 stands out for fast U.S. stock scanning, with TradeAlgo reporting sub-0.8-second scan results. Koyfin is useful when technical and fundamental criteria belong in the same workflow, while ProRealTime offers professional-grade tools and a free end-of-day version.
The simplest approach is usually best: choose one primary charting platform, run repeatable scans, use alerts instead of constant monitoring, organize watchlists by setup, and review every trade with screenshots.
FAQ
What is a technical analysis software workflow?
A technical analysis software workflow is the repeatable process a trader uses to find, validate, track, and review trades with software tools. It usually includes charting, screening, alerts, watchlists, journaling, and post-trade review.
Which platform is best for technical analysis charting?
Based on the provided TradeAlgo research, TradingView leads overall for pure technical analysis, with 400+ built-in indicators, Pine Script customization, and a community of more than 60 million users. However, the best choice depends on the workflow: TrendSpider is stronger for automation, while TC2000 is strong for U.S. stock scanning.
Should I use more than one trading platform?
You can, but each platform should have a clear role. For example, one platform may be your primary charting tool, while another handles scanning or flow confirmation. Using multiple platforms without defined roles can increase confusion and overtrading.
How do alerts help reduce overtrading?
Alerts reduce the need to constantly watch charts. Instead of reacting to every price movement, you define important levels or conditions in advance. When an alert triggers, you review the setup rather than automatically entering a trade.
What should I include in a trade journal?
A useful journal should include the setup type, chart context, indicators used, trigger level, screenshots, rule compliance, and outcome. Screenshots are especially helpful because they show what the chart looked like before the result was known.
How often should I review my trading workflow?
A weekly review is practical for most active traders. Review scan quality, alert usefulness, watchlist clutter, trade screenshots, and whether your software stack is helping or duplicating tasks.