NZD/USD has pushed to around 0.5775, its strongest level in three weeks, but the rally still sits below the technical zone that would force a cleaner rethink of the pair’s broader downside bias.
XOOMAR Intelligence
Analyst Take
The move follows a hawkish Reserve Bank of New Zealand decision, with the RBNZ raising its key interest rate by 25 basis points to 2.50% and signaling the possibility of more hikes this year, according to FXStreet. That gives the Kiwi a real catalyst. It doesn’t yet give it a confirmed breakout.
NZD/USD Bulls Have a Credibility Problem Until 0.5800 Breaks
The clean read on NZD/USD price forecast is this: buyers have momentum, but not control.
The pair is trading in positive territory above 0.5750, and that matters because the New Zealand Dollar has finally drawn strength from policy rather than just short-term dollar softness. The RBNZ did more than hike. It shifted market expectations.
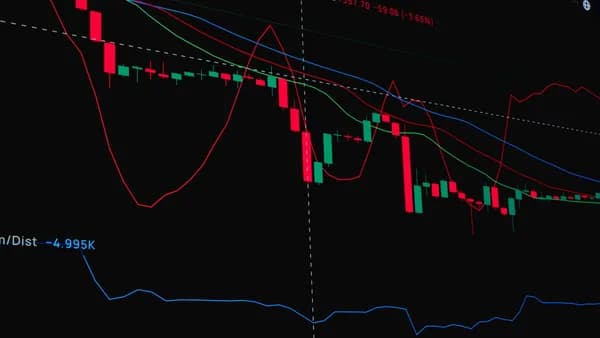
Still, the chart has not cleared the resistance cluster that would make dollar bulls uncomfortable, a familiar technical hurdle for GBP/USD bulls at resistance and EUR/USD bulls at 1.1460. FXStreet’s technical map puts the upper Bollinger Band near 0.5825, with the 100-day Simple Moving Average just above at 0.5840. That is the real test.
A push toward 0.5800 can excite short-term traders. A sustained break through 0.5825 to 0.5840 would say something stronger: that the Kiwi’s rebound is starting to challenge the structure that has capped previous rallies.
For now, the NZD/USD price forecast remains constructive but conditional. The pair has recovered. It has not escaped.
The RBNZ Rate Signal Put Yield Differentials Back in the Kiwi Dollar’s Favor
The RBNZ’s move changed the market’s short-term read on New Zealand rates. On Wednesday, the central bank lifted the key interest rate by 25 bps to 2.50% and indicated that further tightening could come this year.
That repricing was sharp. Traders are now fully pricing two additional quarter-point rate hikes from the RBNZ through December, according to Bloomberg data cited by FXStreet. Before the meeting, markets priced only a 36% chance of that outcome.
That is the kind of shift FX markets notice.
RBNZ govorner Anna Breman said that the geopolitical environment is still highly uncertain, but the domestic economy has shown a lot of resilience in the past few months despite the fuel shock.
The spelling of “govorner” appears in the supplied source, but the message is clear. The RBNZ is not treating uncertainty as a reason to sit still.
The US Dollar side of the pair is less clearly defined in the source material, even as USD/CHF climbs and Canadian Dollar bears run into a crowded USD trade. FXStreet notes that the rate differential between New Zealand and the US Federal Reserve can play a key role in NZD/USD. XOOMAR interpretation: that means the Kiwi rally needs more than a hawkish RBNZ. It also needs the US rate story to stop pulling capital back toward the dollar.
For more context on how RBNZ signaling has been moving Kiwi pairs, see our prior coverage of RBNZ Rate Signal Jolts New Zealand Dollar Bulls Awake and NZD/USD Snaps Back to 0.5700 as RBNZ Tests Kiwi Bulls.
NZD/USD Technical Levels: Above 0.5750, Resistance at 0.5825, and the Breakout Line Traders Are Watching
The current setup is tight. NZD/USD is around 0.5775, with immediate support identified by FXStreet at the recent price pivot near 0.5770.
Below that sits the Bollinger middle band around 0.5712. A deeper break would bring the lower band near 0.5601 into view, where FXStreet says a move lower would expose an extension of the prevailing downtrend.
The upside is cleaner but harder.
| Level | Role in FXStreet technical map | XOOMAR read |
|---|---|---|
| 0.5770 | Immediate support | First test of whether buyers are still active |
| 0.5712 | Bollinger middle band | Nearby downside support if the bounce fades |
| 0.5825 | Upper Bollinger Band | First major resistance |
| 0.5840 | 100-day SMA | Key technical barrier above resistance |
| 0.5601 | Lower Bollinger Band | Downtrend risk level if support breaks |
A move above 0.5800 would matter psychologically, but the stronger technical signal is a reclaim of 0.5825 to 0.5840. That zone combines the upper Bollinger Band and the 100-day SMA, creating what FXStreet describes as a “tight supply cluster.”
XOOMAR analysis: an intraday push into that area is not enough. The pair needs to hold above it to weaken the bearish technical pressure that still hangs over the daily chart.
The Numbers Behind the Kiwi Rebound: Three-Week High, Rate Hike, and 65 Pips to the 100-Day SMA
The NZD/USD price forecast now rests on a narrow band of numbers.
Price: Around 0.5775 in early European trading on Friday.
Momentum: Strongest NZD level in three weeks against the USD.
Policy move: RBNZ raised rates by 25 bps to 2.50%.
Market pricing: Traders fully price two additional quarter-point hikes through December, up from a 36% chance before the meeting.
From the current area around 0.5775, the upper Bollinger Band at 0.5825 is roughly 50 pips away. The 100-day SMA at 0.5840 is about 65 pips away. Immediate support at 0.5770 is only about 5 pips below current trade, while the middle Bollinger Band at 0.5712 is roughly 63 pips lower.
That symmetry matters. The pair has about as much distance to the 100-day SMA as it has to the middle Bollinger Band. The market is balanced between confirmation and failure.
The RSI near 55 supports that reading. It points to modest positive momentum, not an overpowered bullish reversal. FXStreet’s technical assessment still says the pair holds below the 100-day SMA and upper Bollinger Band, which keeps the broader downside bias intact.
Exporters, Importers, FX Traders, and the RBNZ Won’t Read This NZD/USD Rally the Same Way
Different players will read this rally through different incentives. The supplied source does not discuss corporate hedging or trade margins, so any stakeholder read has to stay narrow.
For short-term FX traders, the setup is technical. The Kiwi has a catalyst, a three-week high, and a visible resistance zone. That creates a defined trade map rather than a vague bullish story.
For longer-term investors, the source points to confirmation through New Zealand macro data, RBNZ policy, China’s economy, dairy prices, and broader risk sentiment. FXStreet’s NZD explainer notes that China is New Zealand’s biggest trading partner and that dairy is New Zealand’s main export sector. Those links can influence the currency beyond the rate decision itself.
For the RBNZ, the key lens remains inflation and resilience. The central bank’s medium-term inflation aim is 1% to 3%, with a focus near the 2% midpoint, according to the source material. The latest hike signals that policymakers still see a case for restraint.
For dollar traders, NZD/USD strength is a relative-rate question. If New Zealand rate expectations keep rising while US rate expectations soften, the pair gets room to climb. If the US side reasserts itself, the Kiwi’s technical ceiling becomes harder to break.
How Today’s NZD/USD Setup Compares With RBNZ-Driven Kiwi Rallies
The supplied material does not provide specific past RBNZ rally episodes, so the useful comparison here is structural rather than historical.
RBNZ-driven NZD rallies usually need two stages. First comes the policy shock or hawkish signal. This week delivered that through the 25 bps hike and the repricing toward two more quarter-point moves.
The second stage is harder. The currency has to prove the move can survive broader inputs: the US Dollar path, China-linked demand, dairy prices, and global risk sentiment. FXStreet identifies all of those as relevant NZD drivers.
That is why a three-week high is not enough by itself. It shows the Kiwi has recovered. It does not prove that the pair has reversed trend.
This is also why the resistance cluster near 0.5825 to 0.5840 carries more weight than the headline level above 0.5750. The market has already rewarded the RBNZ. Now the chart has to confirm that buyers are willing to pay higher prices.
NZD/USD Forecast: A Clean Break Above 0.5825 Opens the Door, but the Dollar Side Can Still Shut It
The near-term NZD/USD price forecast is bullish only above resistance.
A cleaner upside case would require NZD/USD to break and hold above 0.5825, then reclaim the 100-day SMA at 0.5840. That would ease bearish pressure and give the Kiwi rally a stronger technical base.
A neutral case is more likely if the pair stays trapped between the current area around 0.5775 and the resistance cluster above 0.5825. That would leave traders waiting for the next RBNZ signal, New Zealand data, Fed-rate repricing, or a shift in risk sentiment.
The bearish case starts if 0.5770 fails and the pair slides toward 0.5712. A break below the lower Bollinger Band near 0.5601 would point back toward the prevailing downtrend, according to FXStreet’s technical map.
XOOMAR base case: the Kiwi has earned a rebound, but not yet a reversal. The RBNZ gave NZD/USD a reason to climb. The chart is asking for proof. Patience beats chasing while the pair remains below the resistance that would validate a larger move.
Disclaimer: This XOOMAR analysis is for informational and educational purposes only. It is not financial, investment, legal, tax, or professional advice. It does not provide buy, sell, hold, price-target, portfolio, or personalized recommendations. Verify information independently and consult qualified professionals before making decisions.
The Bottom Line
- NZD/USD is gaining momentum after the RBNZ raised rates by 25 basis points to 2.50%.
- The pair remains below key resistance at 0.5825 to 0.5840, keeping the broader downside bias intact.
- A sustained breakout above resistance could signal a stronger shift in sentiment toward the New Zealand Dollar.
NZD/USD Key Technical Levels
Primary Sources & Disclosures
Disclaimer: Content on XOOMAR is produced using AI-assisted research, drafting, and verification workflows and is intended for informational and educational purposes only. It does not constitute financial, investment, legal, tax, medical, or professional advice of any kind. All analysis reflects available information at the time of publication and may not be current. Verify information independently and consult qualified professionals before making decisions. Editorial policy

Written by
XOOMAR Insights Team
Research and Editorial Desk
The XOOMAR Insights Team pairs automated research with human editorial judgment. We track hundreds of sources across technology, fintech, trading, SaaS, and cybersecurity, cross-check the facts, and explain what happened, why it matters, and what to watch next. We do not just rewrite headlines. Every article is fact-checked and scored for reliability before it goes live, and we link back to the original sources so you can verify anything yourself.