
West Texas Intermediate crude oil trades at $80.50 as the market hits a technical and fundamental standoff. According to the analysis from FXStreet, the commodity is down 1.35% on the day, caught between Middle Eastern supply fears and a darkening demand outlook. The real story lies not in the headline number, but in what it isn’t doing. Despite clear geopolitical tension, bullish momentum is absent. Instead, technical indicators show a market holding its breath: Bollinger Bands are widening, signaling heightened volatility, while the Relative Strength Index (RSI) hovers near the neutral 50 mark and the MACD flattens around zero. This isn't just a price, it's a riddle. Why isn't the market reacting more violently to the threat of war in the world's most critical oil chokepoint? The answer, buried in the fine print of demand downgrades, suggests a slower, more profound shift may be taking hold.
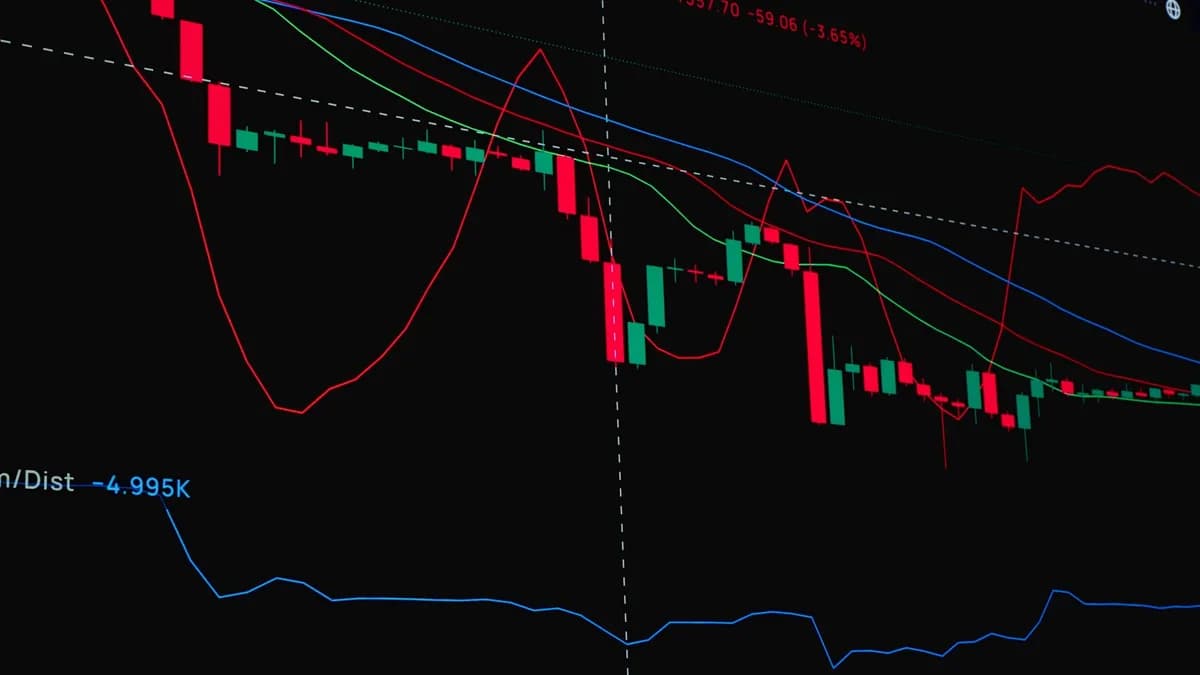
Crude Oil's Missing War Premium Puzzles Traders
XOOMAR Intelligence
Analyst Take
Oil Dips as the Market Grapples with a Riddle: Too Much Fear or Not Enough?
The price of crude often acts as a real-time geopolitical and economic barometer. Today, it's showing contradictory readings. On one side, there's a clear and present danger to supply. The Strait of Hormuz remains a flashpoint, with the United States and Iran both claiming control of the waterway and commercial shipping still throttled. Historically, such a standoff would send traders scrambling to buy, embedding a significant risk premium. Yet that premium seems to be capped, preventing WTI from rallying. On the other side, an equally powerful force is pressing down. The world's two most-watched energy agencies have taken an axe to their demand growth forecasts. OPEC cut its 2026 demand growth outlook to 580,000 barrels per day, down from 780,000 bpd. The International Energy Agency (IEA) is far more bearish, forecasting demand to actually fall by 1.6 million bpd over the same period. This creates a fundamental stalemate. The market can’t break higher because demand fears mute the frenzy over supply. It can’t collapse lower because the risk of a supply shock provides a floor. $80.50 becomes the precarious fulcrum point of this deadlock.
The Numbers Tell a Split-Personality Story for Crude
The 1.35% daily drop to $80.50 is a symptom of the deeper standoff. The technical picture perfectly captures the market's schizophrenia.
The widening Bollinger Bands point to rising volatility, with the upper band at $90.13 and the lower band at $73.12.
This is a critical technical signal. Think of the Bollinger Bands as the market's "pressure gauge." When they expand, it means volatility is increasing and the market is storing energy for a larger move, though the direction remains unknown. The fact that momentum indicators like the RSI and MACD are flat while volatility rises is unusual. It suggests the market is being pulled equally in opposite directions, creating a coiled tension. Moves are sharp but lack follow-through. A decisive close outside of these bands will signal which narrative, supply fear or demand destruction, has won the immediate battle. The demand data provides the core bearish fuel. The gap between OPEC's revised forecast (slower growth) and the IEA's (absolute decline) is itself telling. It reflects deep uncertainty about the trajectory of the global economy and the pace of the energy transition. The supply risk is real but lacks a precise barrel count in the data, operating more as a psychological floor. From a XOOMAR interpretation, the current price action indicates that for traders, the tangible, quantifiable "demand drag" from those forecast cuts currently outweighs the speculative "geopolitical premium." This dynamic can change in an instant, a reality that keeps the Bollinger Bands wide apart.
From Trading Pits to Boardrooms: How Stakeholders Are Reading the Tea Leaves
Each player in the oil complex sees this standoff through a different lens, and that fragmentation is why a clear trend hasn't emerged. The Trader's View: For a technical day trader, this is a textbook environment for range-bound strategies. The clear resistance at the 20-day Simple Moving Average ($81.63) and the wide Bollinger Bands create a defined, albeit volatile, playing field until a breakout occurs. The flat momentum oscillators like the RSI mean mean-reversion trades are in vogue. However, this period of consolidation in volatile markets is precisely when many Standard Backtesters Fail Options Strategies, Demand Specialized Tools, as options traders struggle to model the probability of a violent breakout that hasn't yet arrived. The Producer's Dilemma (OPEC+): Inside OPEC+, the widening gap between their own forecasts and the IEA's creates a policy headache. Do they cut production further to defend prices near current levels, risking loss of market share? Or do they accept a lower price environment to maintain volume, potentially straining fiscal budgets of member states? Their next move will be a direct response to how they interpret this demand weakness: cyclical or structural. The Consumer's Sigh of Relief: For industrial buyers and central banks, contained oil prices are a relief. It eases input cost pressures and removes a volatile component from inflation calculations. The IEA, with its stark forecast, sees vindication for its energy transition advocacy. The muted price reaction to Middle East tensions might also be read as the "geopolitical gambler" in the market calling a bluff, betting that neither side will trigger a full-scale disruption of flows.
The Ghost of 2014: Echoes of a Previous Price Collapse
History offers a sobering comparison point. The 2014-2015 oil price collapse was a one-two punch: the surge of resilient U.S. shale output met a slowing global demand growth engine. The key difference today is the presence of a coordinated OPEC+ supply management bloc, which has proven its willingness to cut production to provide a price floor. However, the current demand-side warnings from the IEA and even OPEC itself echo that earlier period's fundamental weakness. This is not the demand shock of the 2020 pandemic. That was a sudden stop. This is a slower, grinding revision of future expectations, a "slow bleed" that is harder for markets to price dramatically but may have deeper long-term consequences. The critical, unanswered question is whether we are witnessing the early signals of a structural peak in oil demand due to efficiency gains and electrification, or simply a cyclical soft patch in the global economy. The answer dictates everything. If it's structural, today's price action is the beginning of a long-term re-rating. If it's cyclical, this is a buying opportunity. Today's flat momentum suggests the market is terrified of guessing wrong.
What Flat Oil Momentum Means for Your Portfolio and the Pump
The stagnation at $80.50, under a cloud of high volatility, has direct and delayed effects. For Energy Investors: A range-bound, volatile oil price creates winners and losers. Highly leveraged shale producers suffer from stagnant cash flow and hedging difficulties. Integrated majors with large refining operations, however, can thrive in this environment as their downstream segments benefit from stable input costs. Energy sector ETFs may become decoupled from the broader S&P 500, trading purely on this supply/demand deadlock rather than general market risk sentiment. For traders navigating this, the right tools matter, which may explain why some Modern Traders Ditch MetaTrader for Risk-Free Platforms that offer better simulation of these choppy, non-trending conditions. For Inflation and the Fed: Persistent containment of oil prices removes a major potential accelerant from the inflation equation. It gives central bankers more room to focus on "stickier" core services inflation without the distraction of an energy spike. For the Everyday Driver: There's a lag. Gasoline prices at the pump won't fall in lockstep with a 1.35% dip in crude. Refinery margins, taxes, and distribution costs create a buffer. However, if this period of capped crude prices is sustained, the downward pressure will eventually translate to some relief. The expanding Bollinger Bands warn that the current calm at the pump could be fragile.
The Coming Volatility Spike: Three Triggers That Could Shatter the Calm
The technical setup is a coiled spring. Expanding bands signal that a period of violent resolution is highly probable. The flat momentum suggests the market is waiting for a definitive catalyst to choose a direction. Here are three plausible triggers that would force the spring to unload. Trigger 1: A Credible Supply Cut, Not Just a Threat. The current risk premium is based on a threat to shipping. A trigger would be a tangible, lasting severance of flows, a tanker sinking, a pipeline bombing, or a military order closing the Strait. This would instantly validate the fear trade and overwhelm the demand narrative, likely sending price toward the upper Bollinger Band at $90.13. Trigger 2: Macroeconomic Capitulation. The demand warnings would turn into a market panic with a major, confirming data point: a deep, sustained drop in Chinese industrial activity, a U.S. recession confirmation, or a coordinated downgrade of global GDP forecasts by the IMF or World Bank. This would force a recognition that the IEA's bearish outlook is the correct one, breaking the price below the lower band at $73.12. Trigger 3: The OPEC+ Fracture. The internal tension within the producer group could snap. A scenario where a key member (or group) abandons production cuts to chase market share, declaring a price war, would shatter the current supply-side support. This would be a re-run of 2014-2016, but potentially faster and more severe. The trader's axiom holds true: expanding Bollinger Bands don't predict direction, they predict force. A violent resolution to this tension is mathematically likely. Based on the weight of evidence, the specific, quantifiable demand forecast cuts from both OPEC and the IEA versus the ambiguous, ongoing supply threat, the path of least resistance appears skewed to the downside. For a sustained bullish breakout, the market needs to see the demand story disproven. For a bearish collapse, it only needs to see the demand story confirmed. The burden of proof rests on the bulls. Until that proof arrives, the flat momentum at $80.50 is the quiet before a storm.
Disclaimer: This XOOMAR analysis is for informational and educational purposes only. It is not financial, investment, legal, tax, or professional advice. It does not provide buy, sell, hold, price-target, portfolio, or personalized recommendations. Verify information independently and consult qualified professionals before making decisions.
Why It Matters
- A critical global oil price is stuck despite geopolitical tensions, revealing a rare battle between supply fears and weakening demand.
- Major energy agencies (OPEC and IEA) have significantly slashed or reversed their oil demand growth forecasts, signaling a deeper economic or structural shift.
- Technical indicators for oil suggest the market is entering a high-volatility lull, potentially foreshadowing a major price movement in either direction.
Demand Growth Forecasts (2026)
| Agency | Barrels Per Day (bpd) |
|---|---|
| OPEC | 580,000 bpd |
| International Energy Agency (IEA) | -1,600,000 bpd (fall) |
Disclaimer: Content on XOOMAR is produced using AI-assisted research, drafting, and verification workflows and is intended for informational and educational purposes only. It does not constitute financial, investment, legal, tax, medical, or professional advice of any kind. All analysis reflects available information at the time of publication and may not be current. Verify information independently and consult qualified professionals before making decisions. Editorial policy

Written by
XOOMAR Insights Team
Research and Editorial Desk
The XOOMAR Insights Team pairs automated research with human editorial judgment. We track hundreds of sources across technology, fintech, trading, SaaS, and cybersecurity, cross-check the facts, and explain what happened, why it matters, and what to watch next. We do not just rewrite headlines. Every article is fact-checked and scored for reliability before it goes live, and we link back to the original sources so you can verify anything yourself.
Explore More Topics
Related Articles
 Trading
Strait of Hormuz Shutdown Lifts Oil Prices 6%
WTI crude oil jumped over 6% after Iran confirmed talks on shipping routes don't mean the Strait of Hormuz will reopen, setting the stage for a prolonged geopol
 Trading
WTI Crude Paralyzed at $74 Amid Hormuz Showdown
WTI crude prices are stuck near three-week lows, not due to calm but to paralysis as traders await a binary outcome for the Strait of Hormuz that could detonate
 Trading
Trump Demands Iran Pay as Iran Deal Collapse Jolts Oil 7%
Diplomatic posturing dashed any hope for a quick US-Iran deal, triggering a 7% surge in crude oil prices and a global scramble for safety assets, overriding all
 Trading
War Premium Vanishes as WTI Oil Plunges 7.76% on Iran Talks
WTI oil fell 7.76% as Trump paused a strike on Iran, stripping out the war premium tied to the Strait of Hormuz.
 Trading
WTI Crude Nears $83 Threatening Geopolitical Flashpoint
WTI crude oil's rally is testing a critical resistance level near $83, a move that will determine if bullish momentum fueled by Middle East supply threats is re
 Fintech
Figure's $226 Million Quarter Proves Blockchain Beat Lenders
Fintech firm Figure posted $226M in quarterly revenue as its blockchain loan marketplace volume jumped 132%, a real-world stress test showing on-chain rails sca
 Trading
Best Cloud Charting Tools Power Traders' Real-Time Decisions
Cloud-based charting platforms are essential for day traders, providing professional-level technical analysis from any browser without the cost and complexity o
 Fintech
Automate Your Crypto Accounting Before IRS Form Arrives
Manual entry between crypto tax reports and accounting software creates risk as IRS enforcement grows. Automating this bridge ensures audit-ready accuracy and c
 Global Trends
Hockey Canada Suspensions Spark Fury Over Inconsistent Punishment
Four Canadian hockey players face suspensions up to 12 years for a collective code violation, while a fifth was reinstated immediately, exposing an opaque and s
 Fintech
Your Bank App Now Funds Your Shopping Sprees
Leading banks are integrating buy now, pay later directly into their mobile apps, moving BNPL from a checkout feature to a core banking service. This strategic
Don't miss the signal
Get our weekly roundup of the stories that matter across tech, fintech, and trading. No noise, just signal.
Free forever. No spam. Unsubscribe anytime.