Silver's Mid-$68s Shakeout Reveals a Market Still Hungry for Gains
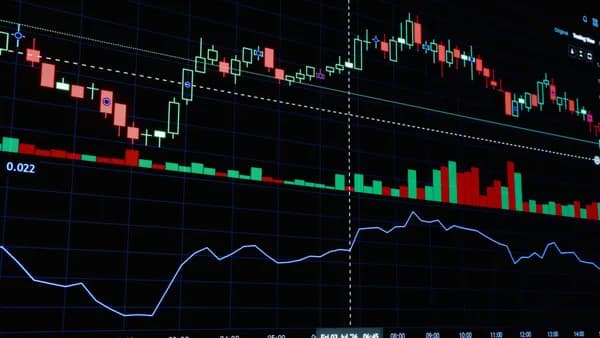
Silver’s brief drop below $68.00 on Thursday wasn't a sign of failure. It was a diagnostic test for the bulls, and they passed. After pulling back from near $70.00, the XAG/USD pair found decisive buyers above $67.40 to quickly trim losses and return to the mid-$68.00s, according to FXStreet. This bounce wasn't random. It was a targeted defense that confirms $67.40 as a new tactical floor in a market that refuses to cool off.
XOOMAR Intelligence
Analyst Take
This action transforms what could have been a full-blown correction into a mere consolidation shake. The swift rejection of a deeper drop signals that underlying physical and investment demand remains robust. It shows traders are still looking to buy, not sell, at these elevated levels.
The broader trend remains bullish, with price action steady above previous highs around $67.00.
This price behavior sets a clear near-term playbook. Any future pullbacks should now be watched at this $67.40 zone. A failure there would signal a deeper correction is underway, but the market's immediate reaction suggests the path of least resistance, for now, is sideways to up.
The $70 Psychological Ceiling: Why Silver Bulls Keep Hitting a Wall
The $70.00 level isn't just another number on a chart. It's a psychological and technical fortress that has capped silver's advance multiple times, most recently this week. The metal rallied powerfully from mid-July lows below $55.00, but bulls have consistently struggled to achieve a decisive break above $70.
The resistance is concentrated. It clusters between the mid-June highs at $71.55 and the closely-watched 200-day Simple Moving Average (SMA), which fluctuates around $72.40. This zone represents a significant technical barrier where past sellers have emerged and profit-taking accelerates.
This repeated rejection isn't necessarily bearish. In a maturing bullish trend, it's normal. It shakes out short-term speculators and builds latent energy for the next breakout attempt. The fact that silver can hold major gains and repeatedly test this ceiling speaks to underlying strength, not weakness. Each failed attempt weakens the resistance by absorbing selling pressure.
Traders watching from the sidelines, as noted in the source material, are waiting for a catalyst. That catalyst will likely be comments from Federal Reserve Chairman Kevin Warsh at the Jackson Hole summit, which could tip the scales for the U.S. dollar and, by extension, dollar-priced metals like silver.
A Decade in the Making: How Silver's Current Run Differs from Past Rallies
Silver's surge in 2011 to nearly $50 an ounce was a classic speculative frenzy, driven largely by monetary stimulus and a dash for hard assets post-financial crisis. The current run toward $70 is built on a broader, more complex foundation.
Key differences in the current rally:
| 2026 Rally Drivers | 2011 Rally Drivers |
|---|---|
| Monetary debasement fears & persistent inflation | Post-crisis quantitative easing & safe-haven rush |
| Structural green energy demand (solar, EVs) | Primarily investment/speculative demand |
| Sustained ETF and futures investment inflows | Retail and momentum-driven speculation |
| Higher baseline of industrial consumption | More cyclical industrial use |
This time, industrial demand from sectors like solar panel manufacturing and electronics provides a fundamental floor that was less pronounced over a decade ago. Silver is no longer just a "poor man's gold"; it's a critical industrial input in the energy transition, as noted in the supplementary FXStreet analysis on its high electrical conductivity. Furthermore, the market structure now includes consistent investment flows through vehicles like ETFs, which create a more persistent bid than the frenetic retail buying of the past.
This combination suggests the current rally may have more staying power, even if it advances in a staggered, consolidation-heavy manner rather than in a straight vertical line.
Bull vs. Bear: The Competing Narratives Shaping Silver's Next Big Move
The battle for silver’s next $5 move is a clash of macroeconomic stories.
The Bull Case is a powerful trifecta:
- Central Bank Policy: A less hawkish Fed, signaled by potential rate cuts, weakens the U.S. dollar and makes non-yielding assets like silver more attractive.
- Sticky Inflation: The recent U.S. PCE data confirmed inflation remains above the Fed's 2% target, preserving silver's appeal as an historical inflation hedge.
- Structural Deficit: Soaring demand from green technologies clashes with constrained mining supply, creating a long-term fundamental deficit.
The Bear Counter argues for a pause or pullback:
- "Higher for Longer" Rates: If the Fed maintains restrictive policy to combat inflation, the opportunity cost of holding silver rises, cooling speculative interest.
- Recessionary Slump: A global economic downturn could crater industrial demand, temporarily overwhelming the investment thesis.
- Technical Exhaustion: Repeated failure at $70.00 could frustrate bulls, leading to a deeper unwind of long positions.
The immediate battleground is the $70.00 line. A break above it validates the bull narrative and could trigger a momentum surge. A rejection and fall below the new $67.40 support would give credence to the bears and likely force a retest of stronger support zones. The market's subdued volatility ahead of Jackson Hole shows investors know this clash is imminent.
By the Numbers: The Technical Levels Every Silver Trader is Watching Now
For traders, this consolidation phase maps to a clear hierarchy of price levels. The recent price action has explicitly defined the battlefield.
The Support Ladder: Where Buying Could Emerge
- $67.40 / $67.00: The new immediate floor. Thursday's bounce established this as the first line of defense for bulls. A break below signals a short-term trend change.
- $65.00 - $64.50: A major trend support area, aligning with an upslope support trendline. A drop here would indicate a deeper correction but would likely attract strong strategic buying.
- $62.19 / $61.34: The August 19 swing low and the 50-day SMA. A fall to this zone would represent a full retracement of the recent leg up and threaten the broader uptrend.
The Resistance Ceiling: Where Breakouts Begin
- $70.00: The immediate psychological and technical hurdle. A daily and weekly close above here is the minimum requirement for the next leg higher.
- $71.55 - $72.40: The next barrier, encompassing the June highs and the 200-day SMA. Clearing this would open a path toward multi-month highs.
- $75.00 & $80.00: Subsequent psychological targets that come into play if the $72.40 level is convincingly breached.
Momentum Gauge: Is the Trend Healthy? Current readings suggest a bullish but cautious market. The Relative Strength Index (RSI) near 63 indicates firm momentum without extreme overbought conditions. The Moving Average Convergence Divergence (MACD) is moderating but remains positive. This fits a market that is pausing, not reversing.
What This Price Action Means for Miners, Industry, and Your Portfolio
The metal's ability to defend $67.40 and trade firmly in the high-$60s isn't just a chart pattern. It has real-world implications.
For Mining Stocks & Streaming Companies: Prices sustaining above $68 fundamentally alter project economics. Margins expand significantly, making secondary deposits economically viable and boosting cash flow for dividends and exploration. It validates expansion plans locked in during lower price environments.
For Industrial Users: Volatility near key technical levels complicates supply chain planning. Manufacturers may accelerate physical purchases or hedging activity if a breakout above $70 seems imminent, fearing even higher costs. Conversely, a dip toward $67 may be seen as a buying opportunity for physical inventory.
For Investors: This price action suggests a specific tactic. The market's quick rejection of dips shows buying weakness is currently more reliable than chasing strength. A strategy of setting limit orders near defined support levels (like $67.40) may be more effective than market orders during breakouts, which have so far been false starts. This behavior underscores silver's current phase: a strong trend undergoing a healthy, high-level consolidation, much like the dynamics we explored in Silver Stalls as Inflation Threat Turns Against It.
The Path Forward: Scenarios for Silver's Breakout or Breakdown
Silver is coiled, waiting for the macro catalyst from Jackson Hole. Two clear paths emerge from the current compression.
Scenario 1: The Breakout A weekly close above $70.50, especially if accompanied by a dovish tilt from the Fed, would be the green light. This would likely trigger automated buying from systematic funds and attract momentum capital chasing the new high. The initial target becomes the 200-day SMA near $72.40, with $75.00 quickly coming into view. Such a move would confirm the bull narrative is in control.
Scenario 2: The Deeper Correction A failure to hold $67.40 on a daily closing basis would signal the consolidation is turning into a more meaningful pullback. The next target would be the $65.00 - $64.50 support band. This would shake out weaker hands and likely be driven by a resilient U.S. dollar or hawkish Fed rhetoric. However, given the fundamental drivers, this scenario would probably find strong buyer interest at those lower levels, setting up a potentially stronger base for the next advance.
XOOMAR Interpretation: The balance of forces, based on the market's swift defense of $67.40, favors the bulls. The dip was bought aggressively, revealing underlying appetite. This suggests the structural bid remains firm. While the $70.00 ceiling is real, the next assault on it is likely to succeed within the coming quarter, especially if industrial demand narratives persist and monetary policy expectations soften, a theme consistent with the forces described in Silver Soars 7% as US Treasury Chooses Weaker Dollar.
The watch item is simple: track the $67.40 support and the $70.00 resistance. The first one to break will dictate silver's direction for weeks to come.
Disclaimer: This XOOMAR analysis is for informational and educational purposes only. It is not financial, investment, legal, tax, or professional advice. It does not provide buy, sell, hold, price-target, portfolio, or personalized recommendations. Verify information independently and consult qualified professionals before making decisions.
The Bottom Line
- A strong defense at the new $67.40 floor signals sustained bullish investor appetite and physical demand for silver.
- The repeated failure to decisively breach the $70 psychological ceiling defines the immediate trading range and risk/reward for speculators.
- The metal's price action between $67.40 and $72.40 will determine whether the powerful rally from July continues or stalls.
Silver Price (XAG/USD) Key Levels
Primary Sources & Disclosures
Disclaimer: Content on XOOMAR is produced using AI-assisted research, drafting, and verification workflows and is intended for informational and educational purposes only. It does not constitute financial, investment, legal, tax, medical, or professional advice of any kind. All analysis reflects available information at the time of publication and may not be current. Verify information independently and consult qualified professionals before making decisions. Editorial policy

Written by
XOOMAR Insights Team
Research and Editorial Desk
The XOOMAR Insights Team pairs automated research with human editorial judgment. We track hundreds of sources across technology, fintech, trading, SaaS, and cybersecurity, cross-check the facts, and explain what happened, why it matters, and what to watch next. We do not just rewrite headlines. Every article is fact-checked and scored for reliability before it goes live, and we link back to the original sources so you can verify anything yourself.