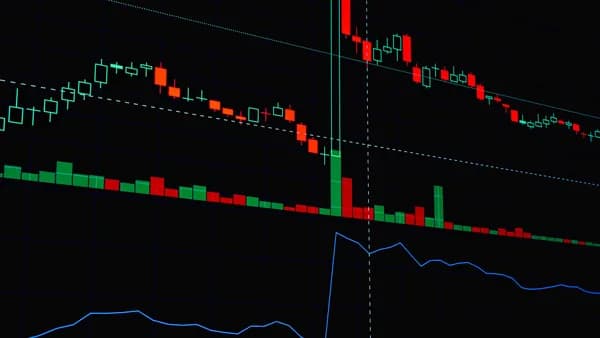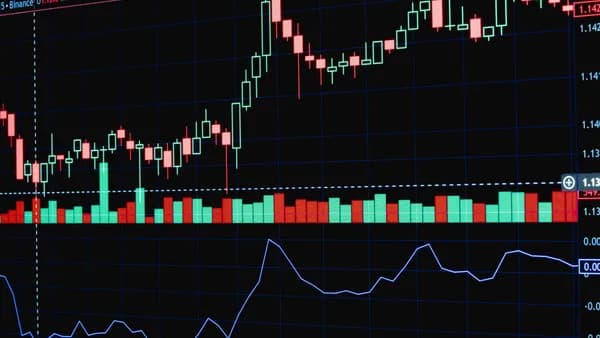
USD/JPY price forecast now turns on a blunt question: can dollar-yen stay above 163.00 long enough to pull 165.00 into play, or does a yen intervention scare finally bite?
XOOMAR Intelligence
Analyst Take
The pair traded around 163.20 during European hours on Thursday after minor losses the previous day, holding near a fresh 40-year high of 163.24 reached on July 21, according to FXStreet. That is not a harmless chart point. It keeps pressure on Japan’s currency narrative and gives macro traders a clean test: momentum against policy discomfort.
USD/JPY above 163 turns yen weakness into a policy credibility test
The technical message is still bullish. USD/JPY remains above both the nine-day Exponential Moving Average and the 50-day Exponential Moving Average, while the shorter EMA sits above the longer one. That alignment tells traders the short-term trend and broader trend are still pointing the same way.
The bigger issue is where this is happening. A move around 163.20 places the pair just below the 163.24 high from July 21, a level FXStreet described as a fresh 40-year high. When a currency pair trades at levels not seen for roughly four decades, chart resistance and policy risk start feeding into each other.
XOOMAR analysis: the bullish thesis stays intact while price holds above the short-term moving averages and inside the ascending channel described by FXStreet. The threat to that thesis is not ordinary profit-taking. It’s either a break below the channel, or a credible official shock strong enough to make traders stop treating yen dips as entries.
That tension also links directly to our related coverage of Intervention Fear Knocks USD/JPY Back From 40-Year High, where the core risk was the same: the higher dollar-yen climbs, the more unstable the trade becomes.
The USD/JPY price forecast still favors dollar bulls while EMAs hold
The chart structure is simple. Spot is above the nine-day EMA at 162.71 and above the 50-day EMA at 161.16. FXStreet also says the pair is moving higher within an ascending channel pattern, which keeps the technical bias tilted upward.
The next upside marker is the upper boundary of that ascending channel around 165.00. That does not mean USD/JPY must go there. It means the chart gives bulls a visible destination if the pair clears or sustains pressure near the recent high.
The first downside level is more immediate. FXStreet identifies 162.71 as primary support, followed by the lower boundary of the channel around 162.50. If price breaks the channel on a sustained basis, the 50-day EMA at 161.16 becomes exposed.
A deeper decline below that medium-term moving average would shift the tone. FXStreet says further losses below the 50-day EMA would cause a bearish emergence and put pressure on the pair toward the region around the four-month low of 155.04, recorded on May 6.
For now, minor daily losses don’t break the setup. They only matter if they start turning support levels into resistance.
The numbers behind the yen selloff are unusually clean
The 14-day Relative Strength Index at 66.10 sits in bullish territory, according to FXStreet. That signals strong upside momentum, but not an extreme reading by that indicator’s standard interpretation.
The broader macro explanation comes from the related market-analysis material. TradingNEWS cited a wide rate gap, with US rates at 3.50%-3.75% and Japan at 1.00%, or roughly 250 to 275 basis points in the dollar’s favor. That gap helps explain why carry demand remains difficult to dislodge even when USD/JPY looks stretched.
| Signal | Level or reading | XOOMAR read |
|---|---|---|
| Current zone | Around 163.20 | Holding above the 163.00 handle |
| Fresh high | 163.24 on July 21 | Bulls are pressing a 40-year extreme |
| Primary support | Nine-day EMA at 162.71 | First short-term defense line |
| Channel support | Around 162.50 | Break would weaken the pattern |
| Medium-term support | 50-day EMA at 161.16 | Loss would damage the bullish structure |
| Upside channel area | Around 165.00 | Next major technical magnet |
| Momentum | 14-day RSI at 66.10 | Strong, not yet extreme |
This is why the USD/JPY price forecast remains skewed higher on the chart, even as the policy risk rises. The trade is not cheap. It is still working.
Tokyo and traders are reading 163 through different lenses
Japanese officials view yen weakness differently from macro funds. The related TradeVisor material said suspected intervention briefly knocked USD/JPY down to 160.47, but the pair later snapped back, with traders treating the pullback as temporary rather than a trend break.
That detail matters. If markets believe intervention only creates short-lived dips, the policy tool loses some deterrent value. It may still trigger sharp moves. It may still hurt crowded positions. But it doesn’t automatically reverse a trend while rate differentials continue to favor the dollar.
The Federal Reserve side remains central in the related analysis. If US data keeps the dollar supported, dollar-yen bulls have less reason to abandon carry. If US data softens enough to change expectations, the support beneath the dollar side of the trade can weaken.
XOOMAR analysis: hedge funds and macro traders are likely to treat the current setup as a momentum and carry trade until intervention headlines move from warning risk to concrete action. That makes positioning discipline more important as USD/JPY approaches the 165.00 channel area.
Readers tracking how yields shape non-FX trades can compare the setup with Treasury Yields Pin Silver Price Forecast Under $60, where rates also sit at the center of the market argument.
History gives one warning: intervention can hurt, but it may not heal
The related market-analysis material notes that the last confirmed intervention in 2024 faded within weeks. It also frames the current move as levels not seen since the mid-1980s. That combination is the uncomfortable part for yen bulls.
Japan can slow a move. It can shock traders. It can make one-sided positioning expensive. But if the rate gap remains wide and the chart keeps making higher levels, intervention risk becomes a volatility event rather than a full trend reversal.
That is the lesson traders appear to be applying now. The pair is holding near 40-year highs despite the risk of official action, and FXStreet’s technical map still points to an ascending channel with 165.00 as the upper boundary.
The danger for dollar bulls is complacency. The closer USD/JPY gets to 165.00, the more crowded the trade can become, and the more violent any intervention-driven yen rebound could be.
A stronger dollar-yen trade changes the risk math for portfolios
For active FX traders, the prescription is not complicated: respect the trend, but don’t ignore the gap risk. The chart favors dip-buying while USD/JPY holds above the key EMAs, but sudden official action can overwhelm normal technical levels.
For global investors with Japanese exposure, the currency leg matters. A weaker yen can change the return profile of Japanese assets once translated back into another currency. Whether that helps or hurts depends on the hedge, the base currency, and the asset mix.
For the real economy, the supplied related material highlights the pressure from imported energy costs, with TradingNEWS pointing to Brent above $91 and Japan’s energy import dependence. That gives yen weakness a domestic cost channel beyond the trading screen.
This is why USD/JPY at 163 is not just a chart story. It is a stress point between market incentives and policy tolerance.
USD/JPY scenarios now cluster around 165, 162.50, and intervention risk
The bullish case is cleanest. If USD/JPY remains above the nine-day EMA at 162.71, holds the ascending channel, and dollar support continues, the pair can retest 163.24 and push toward the channel top near 165.00.
The correction case starts with support. A move below 162.71 would put attention on 162.50. A sustained break below the channel would expose 161.16, the 50-day EMA. Below that, FXStreet’s map points toward the region around 155.04, the four-month low from May 6.
The shock case is official action. A direct yen-support move could produce a fast drop, especially if traders are leaning heavily long dollars. The source material supports that risk, but not its timing.
XOOMAR forecast: the path of least resistance in the USD/JPY price forecast remains higher while price holds above the key EMAs and inside the ascending channel. The evidence that would weaken that view is specific: a sustained channel break, loss of the 50-day EMA, or intervention strong enough to stop traders from buying the next dip.
Disclaimer: This XOOMAR analysis is for informational and educational purposes only. It is not financial, investment, legal, tax, or professional advice. It does not provide buy, sell, hold, price-target, portfolio, or personalized recommendations. Verify information independently and consult qualified professionals before making decisions.
The Bottom Line
- USD/JPY holding above 163.00 keeps bullish momentum focused on a potential move toward 165.00.
- The pair’s proximity to a fresh 40-year high raises the risk of Japanese intervention.
- Traders are watching whether technical strength can survive rising policy pressure.
USD/JPY Bullish Setup vs Intervention Risk
| Factor | Bullish technical case | Policy risk case |
|---|---|---|
| Current level | Trading around 163.20, above 163.00 | Near 40-year highs, increasing official discomfort |
| Key upside level | 165.00 comes into play if momentum holds | Higher levels may raise intervention risk |
| Trend signal | Above nine-day and 50-day EMAs | A break below the ascending channel could weaken the thesis |
Key USD/JPY Levels Mentioned
Primary Sources & Disclosures
Disclaimer: Content on XOOMAR is produced using AI-assisted research, drafting, and verification workflows and is intended for informational and educational purposes only. It does not constitute financial, investment, legal, tax, medical, or professional advice of any kind. All analysis reflects available information at the time of publication and may not be current. Verify information independently and consult qualified professionals before making decisions. Editorial policy

Written by
XOOMAR Insights Team
Research and Editorial Desk
The XOOMAR Insights Team pairs automated research with human editorial judgment. We track hundreds of sources across technology, fintech, trading, SaaS, and cybersecurity, cross-check the facts, and explain what happened, why it matters, and what to watch next. We do not just rewrite headlines. Every article is fact-checked and scored for reliability before it goes live, and we link back to the original sources so you can verify anything yourself.