On Thursday, NOAA declared El Niño has officially begun, and the timing matters because forecasters now see a real chance that this event crosses into super El Niño territory before its biggest weather effects hit winter patterns, according to Wired.
Global TrendsJune 12, 2026· 7 min read· By XOOMAR Insights Team
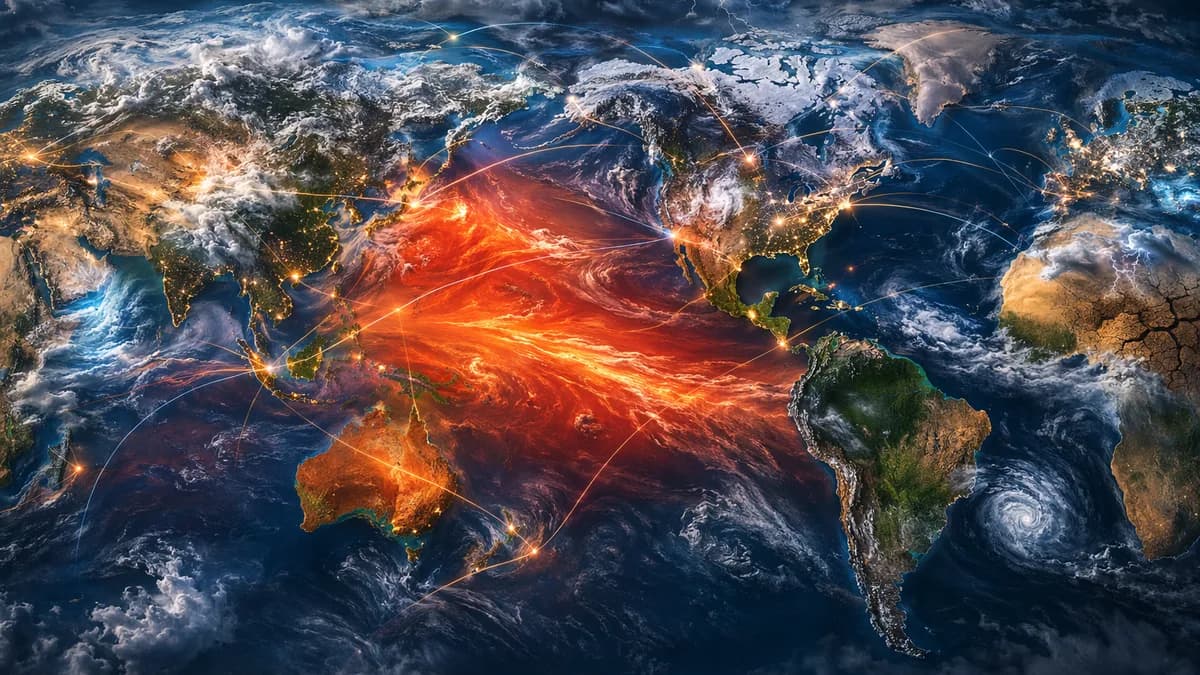
63% Super El Niño Risk Threatens Winter Weather Shock
Updated on June 12, 2026
XOOMAR Intelligence
Analyst Take
58/ 100
4 sources analyzedLow confidenceTrend10Freshness98Source Trust88Factual Grounding94Signal Cluster20
The headline number is stark: NOAA gives this El Niño a 63 percent chance of exceeding the 3.6-degree Fahrenheit threshold, equal to 2 degrees Celsius, commonly used for a “super El Niño.” Some climate models cited in the source material go further, showing possible warming above 5.4 degrees Fahrenheit, which would put the event in record-strength territory if verified.
That doesn’t mean every region gets disaster. It means the odds shift hard. The southern U.S. can tilt wetter. The northern U.S. can tilt warmer and drier. Atlantic hurricane activity can be suppressed. Indonesia, the Sahel, Australia, and parts of southern Africa can face higher drought risk. The same climate signal can ease one drought and worsen another flood zone.
For readers tracking the broader risk setup, this follows our earlier coverage of 63% Super El Niño Risk Turns Weather Into a Stress Test. The weather story is also a climate targets planning story.
Thursday’s NOAA declaration starts the clock on winter risk
El Niño begins when unusually warm water builds in the central and eastern tropical Pacific and the atmosphere starts responding. NOAA’s operational threshold is precise: temperatures must run 1 degree Fahrenheit, or 0.5 C, above average for a three-month period in a key Pacific zone known as NINO3.4.
This year, the Pacific crossed that line after what Wired described as a rapid temperature upswing. Another sign showed up in the ocean itself: sea levels surged by up to 7 inches, or 18 centimeters, in the eastern tropical Pacific as west-to-east winds pushed water into the region.
That ocean heat then changes the air above it. Once tropical thunderstorm patterns shift, the effects can propagate into jet streams and storm tracks far from the equator.
“The phenomenon, characterized by hotter-than-normal waters in the eastern tropical Pacific, has a huge impact on weather in nearly every corner of the globe,” Wired reported.
The useful way to read that: El Niño is not a storm. It’s a climate pattern that changes the background odds for storms, droughts, heat, and rainfall.
The 3.6°F line is where “strong” becomes “super”
“Super El Niño” is not NOAA’s formal category in the same way hurricane categories are formal. It’s a shorthand for an unusually intense El Niño, usually pegged to ocean surface temperatures running at least 2 C, or 3.6 F, above average in the relevant Pacific region.
| Signal | Regular El Niño | Potential super El Niño |
|---|---|---|
| NOAA El Niño threshold | 0.5 C / 1 F above average | Already surpassed |
| Common super threshold | Not reached | 2 C / 3.6 F above average |
| Current NOAA probability | El Niño has begun | 63 percent chance of exceeding super threshold |
| Model upside cited by Wired | Strong event | Some models above 5.4 F |
The key is coupling. Warm water alone doesn’t guarantee the full global pattern. Forecasters also watch trade winds, rainfall near the equator, and whether the atmosphere starts behaving like El Niño rather than simply sitting above warm water.
NOAA’s broader explainer says El Niño and La Niña are part of the ENSO cycle, with episodes typically lasting nine to 12 months and occurring every two to seven years on average. That matters because this is not a one-week weather event. It can shape seasonal risk.
California, the Southwest, and the Atlantic sit on different sides of the same Pacific shift
The clearest U.S. signal usually arrives in winter. Warmer tropical Pacific water tends to push the Pacific jet stream south and east. That raises the odds of wetter conditions across the southern tier, including parts of California, the Southwest, the Gulf Coast, and the Southeast.
The northern U.S. and parts of Canada often lean warmer and drier during El Niño winters, though that doesn’t rule out cold snaps. Local weather still depends on timing, short-term atmospheric patterns, and ocean conditions outside the tropical Pacific.
Hurricanes are the other major U.S. risk channel. El Niño often increases wind shear over parts of the Atlantic Basin, which can disrupt tropical cyclone formation or weaken developing storms. The central and eastern Pacific can move the other way, with stronger El Niño conditions often associated with more favorable hurricane conditions there.
This is probability, not a promise. CNN’s supplied reporting notes that the 2023 season showed El Niño is only one influence on the global weather pattern. That’s the right lesson. El Niño loads the dice. It doesn’t write the whole forecast.
The global split: floods in one region, drought in another
A super El Niño can produce sharp contrasts. Wired says it can raise the odds of wet weather in the southwestern U.S. while increasing drought risk in places such as Indonesia and the Sahel region of Africa. CNN’s supplied reporting also flags drought and heat risk in Australia and Indonesia, reduced summer monsoon rain in India and Southeast Asia, and possible drought stress in parts of Southeast Africa.
The food question is real, but it should be stated carefully. The supplied material says strong El Niños can hit economies through disaster losses, food supply disruptions, and related effects. It does not prove a specific grocery price path for this event. The practical point is narrower: when rainfall and heat shift during growing seasons, agricultural supply risk rises.
Climate change adds another layer. El Niño is natural, but it now unfolds on a hotter planet. Wired puts it plainly: El Niño releases extra heat into the atmosphere, warming an already-heating world further. Coral reefs are one visible stress point because hotter ocean water can drive bleaching in systems already struggling with elevated temperatures.
That’s why this is not just a meteorology story. It also sits beside other global stress tests we track, from climate shocks to public-sector readiness, including unrelated but relevant crisis-response stories like Hazmat Scare Locks Down Pentagon, Then Fizzles Fast.
Past super El Niños show the range of damage, not a script
The historical record gives warning signs, not a forecast copy-paste.
Wired cites four other El Niños that reached the super threshold and says all produced widespread problems. The 1982-83 event caused Lake Mead to overflow. The 1997-98 event caused what Wired describes as Indonesia’s worst drought on record. The most recent cited iteration, 2023-24, caused Southern Africa’s worst drought in 100 years, leaving 61 million people requiring food assistance.
Those examples matter because they show the same Pacific mechanism can express itself through very different impacts: too much water in one basin, too little in another, and severe food stress where drought hits vulnerable regions.
The comparison with today should stay cautious. Background warming is higher. Exposure has changed. Forecasting tools have improved. But the core planning lesson is unchanged: when a strong El Niño signal appears months ahead, governments, businesses, and households get a rare warning window.
The next useful signals are winds, water, and seasonal outlooks
The forecast now turns on intensity and atmospheric response. Readers should follow four signals:
- Pacific temperatures: Whether the NINO3.4 region keeps warming toward or beyond the 3.6 F super threshold.
- Trade winds: Weakened or reversed winds can help push warm water east and reinforce El Niño.
- Tropical rainfall: Shifts in thunderstorms near the equator show whether the atmosphere is coupling with the ocean.
- Seasonal forecasts: Regional outlooks will sharpen as winter approaches.
Practical preparation depends on location. In wetter-risk areas, drainage, flood coverage, and travel flexibility matter. In drought-risk regions, water planning matters more. For food and energy, the best stance is not panic, but scenario planning around disruption.
A super El Niño doesn’t guarantee catastrophe. It does raise the odds that normal weather assumptions fail. The next few months will show whether this event merely becomes strong, or whether the Pacific has enough heat and atmospheric feedback to turn 2026 weather into something far harder to manage.
Impact Analysis
- NOAA says El Niño has begun, raising the odds of major winter weather disruptions.
- There is a 63% chance this event exceeds the commonly used super El Niño threshold.
- Regional impacts can diverge sharply, easing risk in some places while worsening drought or flood threats elsewhere.
Potential Regional Effects of El Niño
| Region | Likely Tilt |
|---|---|
| Southern U.S. | Wetter conditions |
| Northern U.S. | Warmer and drier conditions |
| Atlantic hurricane basin | Suppressed hurricane activity |
| Indonesia, Sahel, Australia, southern Africa | Higher drought risk |
El Niño Temperature Benchmarks
NOAA El Niño threshold
°F1
Super El Niño threshold
°F3.6
Possible model warming
°F5.4
Sources
Written by
XOOMAR Insights Team
Research and Editorial Desk
The XOOMAR Insights Team pairs automated research with human editorial judgment. We track hundreds of sources across technology, fintech, trading, SaaS, and cybersecurity, cross-check the facts, and explain what happened, why it matters, and what to watch next. We do not just rewrite headlines. Every article is fact-checked and scored for reliability before it goes live, and we link back to the original sources so you can verify anything yourself.
Explore More Topics
Related Articles
 Global Trends
$10 Trillion Threat Puts 2026 El Niño Off the Charts
Models put 2026 El Niño beyond recorded history, with potential losses near $10 trillion by 2032.
Jul 25, 20267 min
 Global Trends
Trump Tariffs Twist Court Loss into Checkout Tax Fight
Trump recast his tariffs after a court loss. Democrats see an opening, calling them a sales tax on squeezed Americans.
Jul 25, 20269 min
 Global Trends
Wildfire Smoke Kills 1.5 Million as Fire Plans Fail
Wildfire smoke kills far more people than flames, and hotter, drier weather is making suppression-only playbooks dangerously obsolete.
Jul 25, 20268 min
 Global Trends
Oil Shock Exposes Germany Energy Drag Behind Ifo Jump
Germany’s Ifo jump may be stale. Commerzbank sees oil costs capping 2026 growth at just 0.6%.
Jul 28, 20267 min
 Global Trends
Gillard Turns Jacinta Allan Ouster into Sexism Fight
Gillard says Allan faced vile sexism, complicating Carroll's reset and Victorian Labor's construction crackdown.
Jul 29, 20267 min
 Technology
Apple Upgrade Hides iPhone Sticker Shock in Monthly Fees
Apple's lease plan turns rising device prices into smaller monthly payments, making premium hardware feel cheaper without cutting the real cost.
Jul 28, 20268 min
 Fintech
Apple Upgrade Turns iPhone Price Shock into Klarna Rent
Apple is using Klarna leases to soften iPhone, Mac and iPad price shock without cutting prices or loosening its upgrade grip.
Jul 28, 20268 min
 Trading
War Risk Bet Unwinds as Brent Crude Crashes 8.7% in a Day
Brent crude’s 8.7% plunge shows traders dumping war-risk premium, not proof that Gulf energy flows are out of danger.
Jul 28, 20265 min
 Trading
Gold Price Risks $4,000 Breakdown Before Fed Decision
Gold is slipping near $4,000 as traders wait for the Fed's rate signal, with yields and dollar strength threatening support.
Jul 29, 20268 min
 Technology
Fast Metals Mines Toxic Red Mud for Critical Minerals
Fast Metals raised $4.3M to mine critical minerals from red mud. Now it has to prove the leftover waste is safer.
Jul 29, 202612 min
Don't miss the signal
Get our weekly roundup of the stories that matter across tech, fintech, and trading. No noise, just signal.
Free forever. No spam. Unsubscribe anytime.