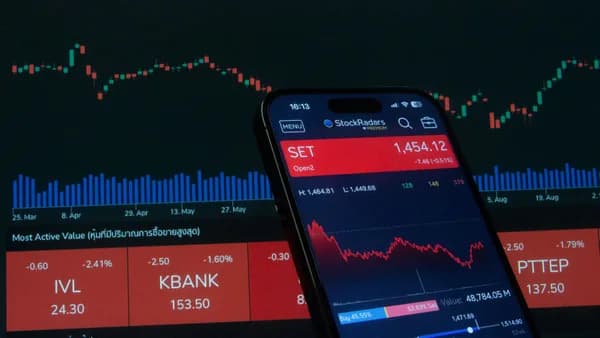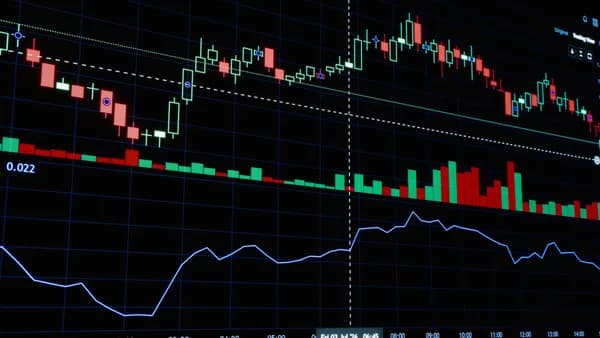
On Wednesday, the euro ran headlong into a wall it has been trying to scale for years: the 200-day Simple Moving Average. The immediate bounce came from a surprise US Treasury announcement, but traders' real focus is on the European Central Bank meeting tomorrow, a showdown that will determine if this is just another fakeout or a genuine breakout according to FXStreet. EUR/USD trades around 1.1640, a hairsbreadth above the key 200-day SMA at 1.1633, but buyers have yet to secure a decisive break.
XOOMAR Intelligence
Analyst Take
The Treasury's Surprise Bid That Stalled the Rally
The US Treasury’s unexpected announcement of a bond-buyback program on Wednesday wasn't catastrophic for the euro, but it was perfectly timed to spoil the party. Here's what happened: the Treasury said it would start buying back some of its outstanding debt. This news, in a counterintuitive twist, initially pushed Treasury yields higher and provided the US Dollar with a brief shot of adrenaline. The mechanics are technical, but the market reaction was simple: a sudden, sharp bid for dollars. This provided enough headwind for EUR/USD to struggle to extend its earlier gains, trimming USD losses just as the euro was testing a critical technical ceiling.
It was a classic example of a volatility spike triggered by an arcane piece of fiscal plumbing. The key question from this move is whether it marks the start of a more durable USD recovery or is merely a temporary market spasm. The fact that EUR/USD didn't collapse and instead held near the 200-day SMA suggests traders are viewing it more as a speed bump than a roadblock, with attention already shifted to Frankfurt.
The Technical Tug-of-War at a Historic Line
The 1.1633 level isn't just another number on a chart. The 200-day Simple Moving Average represents the consensus view of the long-term trend, making it a critical psychological and technical barrier in EUR/USD trading. As strategists at Scotiabank note in the FXStreet report, the tone is "neutral/bullish." The latest bounce in the Euro is "tentative and negligible, but there nonetheless as spot tests marginal one-week highs in the mid-1.16s."
The chart structure, however, is growing more constructive. Price has formed a sequence of higher highs and higher lows since its late-July recovery from below 1.1400. It's now holding above the 50-day and 100-day SMAs, clustering near this more formidable 200-day average. Scotia's analysts point out that momentum is improving: "the RSI is in the upper 50 area and climbing, leaning toward further near-term gains." Meanwhile, the MACD's bearish pressure is easing.
“We anticipate a hawkish hike tomorrow, as President Lagarde unveils the latest forecast and signals ongoing concern about upside risk.”
This bullish momentum faces two immediate challenges. On the upside, resistance awaits at 1.1700 and then 1.1800. On the downside, support levels stack up: the 200-day SMA at 1.1633, the 100-day SMA at 1.1561, the 50-day SMA at 1.1522, and finally the 1.1400 structural level. A break in either direction will be decided by tomorrow's news from the ECB, not today's fleeting Treasury market gyrations.
The Great Decider: The ECB's Hawkish Hike
Traders have been avoiding aggressive bullish bets ahead of Thursday's European Central Bank decision, and for good reason. The market has already priced in the outcome. As Scotia's strategists put it, "a 25bpt rate hike…[is] fully expected at Thursday’s meeting, and another 25bpts…priced in for December."
The trading trigger tomorrow, therefore, won't be the hike itself. It will be the narrative and forecasts that accompany it. The market expects a "hawkish hike," with President Christine Lagarde signaling "ongoing concern about upside risk" to inflation. If she delivers precisely that, reaffirming a commitment to further tightening, it could provide the fundamental justification the euro needs to power through the 200-day SMA. Any deviation, such as a more cautious tone or signs of data dependence that imply a potential pause, would likely be interpreted as dovish and could see the euro rejected from this key level.
This dynamic mirrors tensions in other financial sectors, where central bank policy is reshaping flows. Just as banks are pivoting their business models in response to tightening conditions, as seen in our coverage of Banks Dump Billions in FinTech Deposits in BaaS Pivot, currency markets are hypersensitive to the subtlest shifts in central bank communication.
XOOMAR Analysis: The Paths Forward from 1.1633
The next 48 hours for EUR/USD are less about predicting a single outcome and more about preparing for the volatility that will follow the ECB's message. Based on the technical setup and the firmly baked-in policy expectations, we see three plausible scenarios developing.
Scenario 1: The Hawkish Breakout. This requires the ECB to not only hike but to explicitly validate market expectations for another hike in December, perhaps via upgraded inflation forecasts. Combined with a daily close above the 200-day SMA (ideally above 1.1650), this would shift the technical bias firmly bullish. Initial targets would be the 1.1700 barrier, with a move toward 1.1800 becoming possible.
Scenario 2: The "Wait-and-See" Drift. This is the most frustrating but perhaps most likely outcome. If the ECB delivers the expected hike but couples it with ambiguous, data-dependent guidance, it provides no new directional fuel. EUR/USD could then remain trapped in a choppy range between the 200-day SMA (1.1633) and the 100-day SMA (1.1561), awaiting the next major US or Eurozone data point.
Scenario 3: The Bull Trap Reversal. A decisive failure occurs if the euro is sharply rejected from the 200-day SMA. The trigger would be a perceived dovish tilt from Lagarde, perhaps downplaying upside risks or introducing new concerns about growth. In this case, the immediate support at the 200-day SMA breaks, and the pullback likely tests the 100-day SMA at 1.1561 and the cluster of support down to 1.1400.
Ultimately, the quiet battle at 1.1633 this week is a microcosm of the broader macro conflict between a US economy dealing with fiscal surprises and a Eurozone central bank trying to maintain its inflation-fighting credibility. Traders are looking for the ECB to provide the spark. Whether that spark ignites a sustained rally or simply fizzles out at a familiar resistance wall will define the euro's trajectory for the rest of the quarter. Watch for a sustained daily close, not just an intraday poke, to confirm the next directional move.
Disclaimer: This XOOMAR analysis is for informational and educational purposes only. It is not financial, investment, legal, tax, or professional advice. It does not provide buy, sell, hold, price-target, portfolio, or personalized recommendations. Verify information independently and consult qualified professionals before making decisions.
The Bottom Line
- The 1.1633 level marks the 200-day moving average, a critical technical barrier that traders use to determine long-term trends in currency markets.
- Thursday's European Central Bank meeting will reveal whether the euro can sustain a genuine breakout or if this is just another failed attempt.
- Global currency traders are exposed to volatility as US Treasury policies and ECB decisions create opposing forces on the EUR/USD pair.
EUR/USD Key Levels Comparison
| Asset/Level | Current Value | Significance |
|---|---|---|
| EUR/USD Spot | 1.1640 | Trading level |
| 200-day SMA | 1.1633 | Long-term trend indicator and key resistance |
| US Treasury announcement impact | USD strengthened | Created headwind for euro rally |
EUR/USD vs. 200-day SMA
Primary Sources & Disclosures
Disclaimer: Content on XOOMAR is produced using AI-assisted research, drafting, and verification workflows and is intended for informational and educational purposes only. It does not constitute financial, investment, legal, tax, medical, or professional advice of any kind. All analysis reflects available information at the time of publication and may not be current. Verify information independently and consult qualified professionals before making decisions. Editorial policy

Written by
XOOMAR Insights Team
Research and Editorial Desk
The XOOMAR Insights Team pairs automated research with human editorial judgment. We track hundreds of sources across technology, fintech, trading, SaaS, and cybersecurity, cross-check the facts, and explain what happened, why it matters, and what to watch next. We do not just rewrite headlines. Every article is fact-checked and scored for reliability before it goes live, and we link back to the original sources so you can verify anything yourself.