Gold price action on Wednesday signaled a dollar-led breakout first and a war-risk trade second. XAU/USD surged more than 1.50%, broke a key resistance trendline, and printed a new two-week high as the US Dollar weakened, according to FXStreet.
XOOMAR Intelligence
Analyst Take
That distinction matters. Gold did rise while US-Iran tensions stayed elevated, but the cleaner driver was the softer Greenback. The US Dollar Index (DXY) slipped 0.07% to 101.12, giving bullion buyers room to push spot gold through a technical barrier even as US 10-year Treasury yields rose nearly three basis points to 4.654%.
Gold price breakout says the dollar trade is overpowering the war-risk trade
The strongest read on this move is simple: gold price strength is being unlocked by dollar weakness, not just by fear buying. If the rally were purely geopolitical, traders would expect a more direct safe-haven reaction tied to the US-Iran headlines. Instead, the source points to a softer DXY as the immediate tailwind.
That makes the breakout more sensitive to macro follow-through. If gold is rising because the dollar is losing altitude, the next test comes from Fed expectations, US data, Treasury yields, and whether DXY can stabilize. A war-risk bid can support gold, but a currency-led breakout needs the dollar to stay weak or at least stop pushing back.
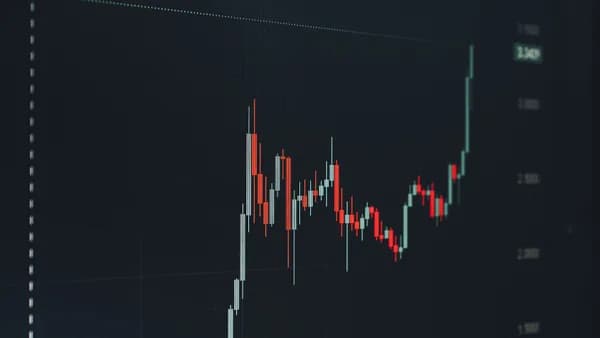
The technical piece adds weight. XAU/USD traded at $4,146 after bouncing from a low of $4,076, reclaiming $4,100 and breaking a downtrend resistance line. Buyers didn't just defend the dip. They forced a fresh two-week high.
That shift matters because gold often needs a trigger to move from range defense to trend extension. Wednesday supplied one. The counterpoint is that one session doesn't prove a durable leg higher. A breakout that fails quickly can trap late buyers, especially if the dollar rebounds.
The XAU/USD numbers behind Wednesday's two-week high
The core move was large enough to matter. XAU/USD climbed more than 1.50% on Wednesday, cracked a key resistance trendline, and reached its highest level in roughly two weeks. That is not a minor intraday squeeze.
The price path also tells a clear story. Gold bounced from the day’s low at $4,076, moved back above $4,100, and traded at $4,146. FXStreet’s technical view says the break clears a path toward $4,200, with the 50-day Simple Moving Average (SMA) at $4,253 as the next near-term target.
| Gold level | Why it matters |
|---|---|
| $4,076 | Wednesday low of the day |
| $4,100 | Reclaimed level and key near-term support |
| $4,146 | FXStreet-cited trading level after the bounce |
| $4,200 | Next upside test after the trendline break |
| $4,253 | 50-day SMA |
| $4,300 and $4,400 | Psychological resistance zones |
| $4,496 | 200-day SMA |
| $3,999 | July 21 daily low if gold breaks back below $4,100 |
| $3,886 | October 28, 2025 low |
Momentum improved too. FXStreet notes that the Relative Strength Index (RSI) turned bullish. A trendline break backed by a daily gain above 1.50% carries more force than a shallow pop, but the next one or two sessions will decide whether this becomes a real extension or just a sharp reset inside a wider range.
US Dollar weakness gives bullion buyers permission to ignore the noise
Gold’s inverse relationship with the dollar is not mechanical, but it is powerful. Since gold is priced in dollars, a weaker Greenback lowers the hurdle for overseas buyers and often gives XAU/USD room to rise when rate pressure is not overwhelming the trade.
Wednesday’s setup was not perfectly clean for bulls. The US 10-year Treasury yield rose nearly three basis points to 4.654%, which would usually work against a yield-less asset. Yet gold still broke higher. That tells us the dollar move and technical buying carried more weight than the yield uptick, at least during this session.
Fed pricing added another layer. Money markets priced a 65% chance that the Fed will keep rates unchanged at the July 29 meeting, down from 78% a day earlier, according to Prime Terminal data cited by FXStreet. That shift does not automatically explain gold’s rally, but it shows traders were actively repricing policy odds.
The bearish rebuttal is straightforward. If DXY rebounds sharply, the gold price breakout could be tested fast, especially if geopolitical headlines cool or yields continue to firm. For related FX pressure points, readers tracking safe-haven dollar behavior can compare this setup with XOOMAR’s coverage of Dollar Snatches Safe-Haven Crown as USD/CHF Climbs.
US-Iran tensions add a safety bid, but they aren't the whole gold story
The geopolitical backdrop remained serious enough to keep a safety bid in the market, but it did not fully control Wednesday’s gold trade. The cleaner signal was still the softer US Dollar, which gave bullion buyers room to push through resistance even as broader headline risk stayed elevated.
Oil reacted more directly to the regional risk backdrop. West Texas Intermediate (WTI) rose more than 6% to $86.80 per barrel after the news broke. That matters for gold because a sustained oil shock can feed inflation concerns, influence yields, and strengthen the dollar’s safe-haven appeal in a deeper crisis.
That is the tension inside the trade. Gold benefits from instability, but the dollar can also attract safety flows in severe stress. FXStreet even flags the risk that a larger-scale war against Iran could push investors to book profits in gold if higher energy prices lift the dollar’s safe-haven appeal.
So the gold price rally is not a clean “war equals gold higher” story. Contained tension can put a floor under bullion. Escalation can pull gold, the dollar, Treasuries, and oil in competing directions. For the crude side of that risk channel, see XOOMAR’s WTI Price Forecast Pins $90 Hopes on One Clean Breakout.
Gold's next move runs through $4,200, then the 50-day SMA
The bullish case is now visible on the chart. Gold has reclaimed $4,100, broken a downtrend resistance line, and created a path toward $4,200. If buyers clear that zone, FXStreet identifies the 50-day SMA at $4,253 as the next target.
Beyond that, the resistance map becomes psychological first, technical second. The next levels are $4,300 and $4,400, followed by the 200-day SMA at $4,496. Those levels do not guarantee selling, but they are obvious places where traders will test whether the breakout has real sponsorship.
The invalidation zone is just as important. FXStreet says a bearish reversal would require gold to drop below $4,100. Under that, the July 21 daily low at $3,999 becomes the next marker, followed by the October 28, 2025 low of $3,886.
The thesis holds as long as the dollar stays soft and gold remains above the broken trendline. It weakens if DXY recovers, yields keep rising, and XAU/USD slips back under $4,100. That would turn Wednesday’s move into a false break rather than the start of a larger advance.
Traders now have three confirmation tests
Short-term gold bulls have the cleanest argument: price broke resistance, momentum turned bullish, and buyers absorbed both higher yields and geopolitical uncertainty. Skeptics have a fair answer: one strong daily move still needs follow-through.
The next confirmation points are practical:
- Dollar follow-through: DXY needs to remain under pressure for the currency-led gold trade to keep working.
- Fed repricing: The market’s shift from a 78% to 65% chance of no July 29 rate change needs context from upcoming data and Fed signals.
- Geopolitical escalation: US-Iran headlines could either reinforce gold’s safety bid or strengthen the dollar through energy-price stress.
Traders are waiting for Initial Jobless Claims for the week ending July 18, S&P Flash PMIs, and the Federal Reserve’s monetary policy decision next week. Those catalysts matter more now because gold’s breakout is tied to the dollar channel.
The practical read: the breakout deserves respect, but not blind trust. If the dollar cannot recover quickly and gold holds above $4,100, XAU/USD has room to challenge $4,200 and then the 50-day SMA. If the dollar snaps back or oil-driven stress boosts demand for cash, Wednesday’s gold price rally could lose altitude just as quickly as it appeared.
Disclaimer: This XOOMAR analysis is for informational and educational purposes only. It is not financial, investment, legal, tax, or professional advice. It does not provide buy, sell, hold, price-target, portfolio, or personalized recommendations. Verify information independently and consult qualified professionals before making decisions.
The Bottom Line
- Gold’s breakout appears more tied to dollar weakness than geopolitical fear.
- A rebound in the US Dollar could quickly test the durability of the move.
- Higher Treasury yields near 4.654% remain a potential headwind for bullion.
Gold Rally Drivers
| Driver | Evidence | Implication |
|---|---|---|
| US Dollar weakness | DXY slipped 0.07% to 101.12 as XAU/USD rose more than 1.50%. | The breakout depends on whether the dollar stays soft. |
| War-risk trade | US-Iran tensions remained elevated. | Geopolitical risk may support gold, but was not the cleaner immediate driver. |
Gold Price Move
Primary Sources & Disclosures
Disclaimer: Content on XOOMAR is produced using AI-assisted research, drafting, and verification workflows and is intended for informational and educational purposes only. It does not constitute financial, investment, legal, tax, medical, or professional advice of any kind. All analysis reflects available information at the time of publication and may not be current. Verify information independently and consult qualified professionals before making decisions. Editorial policy

Written by
XOOMAR Insights Team
Research and Editorial Desk
The XOOMAR Insights Team pairs automated research with human editorial judgment. We track hundreds of sources across technology, fintech, trading, SaaS, and cybersecurity, cross-check the facts, and explain what happened, why it matters, and what to watch next. We do not just rewrite headlines. Every article is fact-checked and scored for reliability before it goes live, and we link back to the original sources so you can verify anything yourself.