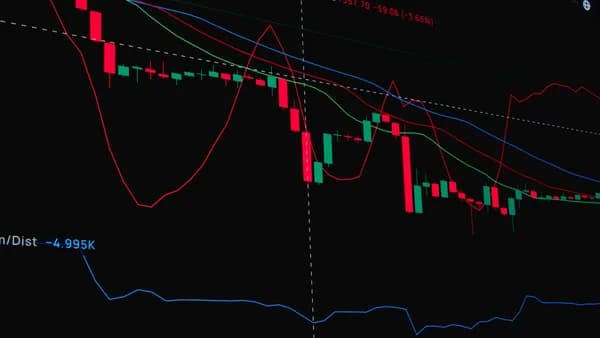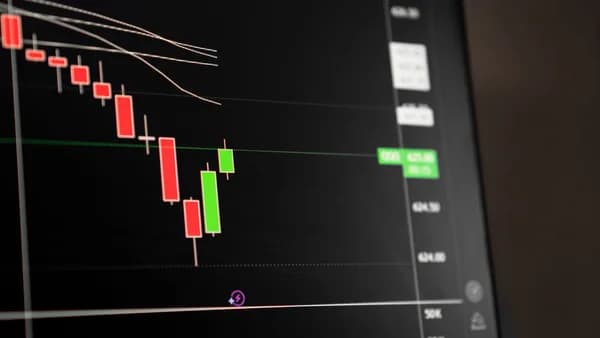
The WTI price forecast has shifted from a simple rebound trade into a shipping-risk premium, with crude bulls now testing whether Middle East headlines can turn a technical recovery into a broader upside break.
XOOMAR Intelligence
Analyst Take
WTI traded around $86.20 on Wednesday after hitting an intraday high of $87.83, its highest level since June 11, according to FXStreet. The move came as rising Middle East tensions disrupted Oil flows through the Strait of Hormuz and the Red Sea, while buyers pushed price toward the 100-day Simple Moving Average near $88.
WTI bulls are buying shipping risk before confirmed barrel losses
XOOMAR analysis: This oil rally is best read as a risk premium trade, not yet proof of a sustained physical shortage. The source material points to disrupted flows and tanker movements, but it does not establish a measured drop in total exports.
The geopolitical fuel is real. FXStreet reports that the US military carried out an eleventh consecutive night of strikes against Iran, while Tehran responded with fresh attacks targeting Bahrain, Kuwait and Jordan. It also says three tankers carrying Saudi crude reportedly reversed course in the Red Sea after threats from the Iran-backed Houthis.
That matters because crude markets move before supply data confirms the damage. Traders do not wait for monthly balances when tankers reverse course or when threats hit chokepoints. They price the risk first, then reassess once the flow picture becomes clearer.
For route-specific context, XOOMAR has been tracking the same pressure point in Iran's Threats Ignite Strait of Hormuz Trade Route Fears. The current WTI bid fits that pattern: shipping uncertainty is doing the work that inventory data usually does.
The $87.83 intraday high puts WTI back in a fight with the 100-day SMA
The chart setup is now the cleanest part of the WTI price forecast. WTI retested the pre-war level near $67 earlier this month, reclaimed the 200-day SMA around $74, and is now testing the 100-day SMA near $88.
That sequence matters. A move from $67 to the high-$80s is not just noise. It shows buyers recovered control after a deep retest and forced price back into a zone where medium-term trend traders have to pay attention.
| WTI level | Source signal | Market read |
|---|---|---|
| $67.00 | Pre-war support zone | Deeper pullback area |
| $74.00 | 200-day SMA | Reclaimed trend support |
| $80.00 | Psychological support | First downside test |
| $87.83 | Intraday high | Highest since June 11 |
| $88.00 | 100-day SMA | Immediate resistance |
| $95.00 | Horizontal resistance zone | Next upside target if breakout holds |
Momentum supports the bulls, but it is not a blank check. FXStreet says the RSI 14 has climbed to 66.61, approaching overbought territory, while the MACD remains positive, with the MACD line above the signal line and a widening positive histogram.
That combination says upside pressure persists. The counterpoint is just as important: a single intraday spike into the 100-day SMA is not the same as a confirmed break. A sustained close above that area would carry more weight than another headline-driven push that fades before settlement.
Hormuz and Red Sea risk explain the speed of the WTI move
The market is reacting fast because the routes in question sit at the center of energy flows. Gulf News reported that the Strait of Hormuz carries roughly one-fifth of global oil consumption and about a third of the world's seaborne crude trade.
That gives the current move a clear transmission chain. Military escalation raises perceived route risk. Tanker reversals or shipping hesitation can affect delivery timing. Traders then add a premium to nearby crude because the risk sits closest to prompt supply.
The Red Sea angle adds another layer. FXStreet’s report that three Saudi crude tankers reversed course after Houthi threats does not prove a lasting disruption, but it does show behavior changing in response to security risk. In oil, behavior often moves price before the hard supply numbers arrive.
Macro inputs can still cap the rally. FXStreet’s FAQ flags the US Dollar, OPEC decisions, and weekly inventory reports from the API and EIA as core WTI drivers. Gulf News also reported comments from New York Fed President John Williams, who said he still expects energy prices to ease over the next six to 12 months.
"I still feel ... the fundamentals are that energy prices are likely to be around their peak and then to come down over time,"
That is the strongest counterweight to the bull case. If supply remains resilient and inventories do not validate the fear trade, the geopolitical premium can shrink quickly.
Traders, producers and inflation watchers are not reading the same signal
Technical traders see a clean test: $88 is the line. A break and hold above the 100-day SMA strengthens the case for a move toward $95.00. A rejection puts $80.00 back in play first, then the 200-day SMA near $74.
Physical buyers read the tape differently. For them, the question is not whether RSI is near overbought. It is whether vessels keep moving, whether Red Sea threats intensify, and whether Hormuz risk stays theoretical or becomes measurable in flows.
Producers benefit from firmer crude, but the source material does not support claims about company cash flows or drilling plans. The better-supported point is broader: FXStreet says OPEC decisions influence WTI, while Gulf News says higher crude costs can filter into gasoline, diesel, aviation fuel, freight rates and consumer prices.
That is why this oil move matters beyond energy screens. If crude remains elevated, it can complicate inflation progress and rate-cut timing. Readers tracking the cross-asset side can pair this with XOOMAR’s Oil Fears Stall Bitcoin Rally After Soft CPI Tease, which covers how energy anxiety can spill into risk-market narratives.
Earlier 2026 price swings show why the first spike is not the full story
The supplied data already shows how unstable this market has been. FXEmpire reported on Jun 4, 2026 that Brent reached $101.70 and WTI reached $96.70 as Middle East tensions lifted supply-risk fears. Gulf News later reported WTI at $72.54 as of 1:27 pm Tokyo time on July 10, 2026.
Now FXStreet has WTI back near $86.20. That path says traders have not settled on a durable clearing price. They are repricing each escalation and each sign of supply resilience.
The key distinction is threatened disruption versus lost barrels. Threats can launch price. Confirmed export losses, inventory draws, or sustained route impairment are what keep price elevated.
This is where lazy forecasts fail. A headline premium can fade if tankers move and inventories build. It can also expand fast if shipping behavior worsens or military exchanges broaden.
WTI price forecast: $88 is the near-term battleground, $95 is the prize
The base case for the WTI price forecast is straightforward: crude stays supported while Middle East shipping risks remain elevated, but the 100-day SMA near $88 decides whether this remains a rebound or turns into a stronger recovery attempt.
The bullish setup needs confirmation. A sustained break above $88 would put the $87.83 intraday high back under pressure and open a path toward the $95.00 horizontal resistance zone cited by FXStreet. Momentum indicators support that case for now.
The bearish setup is equally clear. If flows stabilize, inventory data weakens the supply-risk story, or WTI fails again at the 100-day SMA, the premium can deflate toward $80.00, then $74.00.
The next signal is not a speech or a slogan. It is the daily close around $88, plus evidence from shipping activity and inventory reports that either confirms the fear trade or exposes it as another headline bid.
Disclaimer: This XOOMAR analysis is for informational and educational purposes only. It is not financial, investment, legal, tax, or professional advice. It does not provide buy, sell, hold, price-target, portfolio, or personalized recommendations. Verify information independently and consult qualified professionals before making decisions.
The Bottom Line
- WTI is rising as traders price in shipping risk before confirmed supply losses appear.
- Disruptions around the Strait of Hormuz and Red Sea could raise volatility in global crude markets.
- A break above the 100-day SMA near $88 would strengthen the case for further upside momentum.
WTI Price Levels
Primary Sources & Disclosures
Disclaimer: Content on XOOMAR is produced using AI-assisted research, drafting, and verification workflows and is intended for informational and educational purposes only. It does not constitute financial, investment, legal, tax, medical, or professional advice of any kind. All analysis reflects available information at the time of publication and may not be current. Verify information independently and consult qualified professionals before making decisions. Editorial policy

Written by
XOOMAR Insights Team
Research and Editorial Desk
The XOOMAR Insights Team pairs automated research with human editorial judgment. We track hundreds of sources across technology, fintech, trading, SaaS, and cybersecurity, cross-check the facts, and explain what happened, why it matters, and what to watch next. We do not just rewrite headlines. Every article is fact-checked and scored for reliability before it goes live, and we link back to the original sources so you can verify anything yourself.