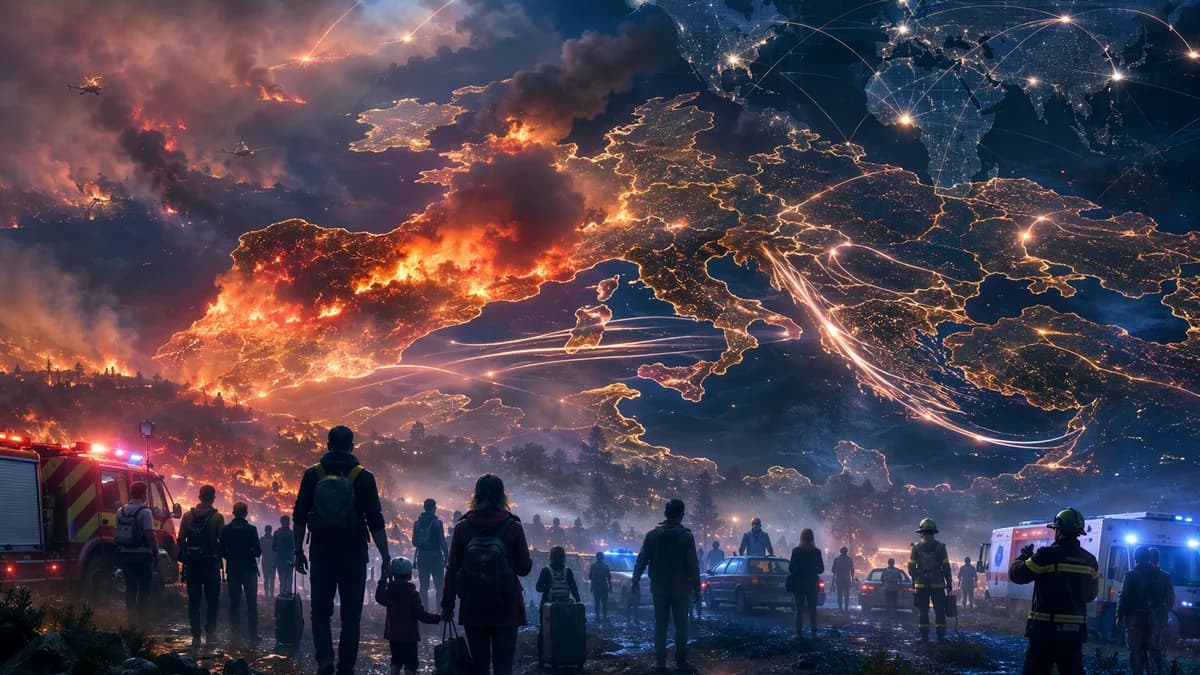
The European wildfires in maps story is no longer just about where flames are burning, it’s about how quickly evacuation zones, industrial risks, and firefighting capacity can be overtaken by heat-driven fire behavior.
XOOMAR Intelligence
Analyst Take
More than 300,000 people have been forced to evacuate across France and Spain, with the Gironde fire near Bordeaux burning more than 162 sq miles (420 sq km) in less than four days, according to BBC World. That is the central signal from the maps: Europe’s fire problem is moving faster than many emergency systems can comfortably absorb.
For residents, the maps show danger closing in. For firefighters, they show stretched perimeters and difficult terrain. For officials, they expose a harder truth: heatwaves, dry vegetation, land use, and preparedness are colliding at speed.
European wildfires in maps are shifting from alerts to damage records
The most useful fire maps now do two jobs at once. They show active-fire hotspots, where satellites detect intense heat, and burnt-area perimeters, where the damage has already spread. That distinction matters because a hotspot is a current signal, while a burnt-area outline is a record of what the fire has already consumed.
The Europe wildfire map data described in the supplied source uses NASA VIIRS at 375 m resolution and MODIS at 1 km resolution, the same underlying data used by EFFIS, the European Forest Fire Information System under Copernicus. These tools can show detections within roughly 2-3 hours, but they are not a live video feed. Clouds, smoke, tree canopy, or satellite timing can hide a fire.
The practical question for anyone reading a map is simple: is this showing where the fire is now, or where it has already been?
That difference changes decisions. A resident deciding whether to leave, a mayor deciding where to close roads, and a fire commander planning containment lines are not reading the same layer in the same way.
Bordeaux and Madrid show how fast a regional fire can become a national stress test
The Bordeaux-area fire is the clearest example of speed. It tore through forests and fields in France’s wine region, burned more than 162 sq miles (420 sq km) in less than four days, and moved to within nine miles (15km) of south Bordeaux.
The human pressure is just as stark. In Gironde, more than 200,000 people have been forced from their homes. The fire has also threatened sensitive military and industrial sites, including facilities linked to French ballistic missiles, rocket motors, and hazardous chemical processing.
Spain’s Madrid region is facing its own historic emergency.
Francisco Martin, a government delegate in Madrid, described the fires as "undoubtedly the largest fire in the history of the Madrid region".
That phrase matters because it frames Madrid not as a routine summer fire zone, but as a region facing a scale officials say it has never seen before. XOOMAR’s earlier reporting on Madrid wildfire evacuations tracked the same pressure point: when evacuation demand rises faster than fire crews can lock down perimeters, the map stops being a planning graphic and becomes a triage tool.
| Area | Source-supported signal | Operational concern |
|---|---|---|
| Gironde near Bordeaux | 162 sq miles (420 sq km) burned in less than four days | Rapid spread near a major city and sensitive sites |
| South of Bordeaux | Fire within nine miles (15km) | Urban edge risk and evacuation pressure |
| Madrid region | Described by an official as the worst in regional history | Firefighting capacity and public safety strain |
The source material does not provide detailed road closures, wind speeds, or town-by-town evacuation routes. So the map-based inference should stay disciplined: the threat is visible in the pace of spread, proximity to Bordeaux, and scale of evacuations, not in unsupported claims about specific corridors.
Fire crews are fighting weather, fuel, and physics at the same time
The fire near Bordeaux has become extreme enough to generate its own fire thunderstorm. That happens when heat from a wildfire forces air to rise fast, carrying smoke, ash, and water vapour high into the atmosphere. If the rising air cools and forms a large enough cumulonimbus cloud, it can produce lightning, which can start new fires.
That is the brutal feedback loop. A fire can create weather that makes the fire harder to stop.
French crews have responded with aircraft loaded with fire retardant and Canadair planes that can scoop 6,000 litres of water from lakes or the sea in 12 seconds. On dangerous days, loaded aircraft patrol high-risk areas before fires are even reported, allowing drops within minutes of a sighting.
Around Gironde, the response has included:
- Firefighters: about 2,500 involved in tackling the blaze.
- Military personnel: about 1,500 deployed.
- Police and gendarmes: about 1,200 involved.
- Firebreaks: near Lacanau, machinery has carved a strip as wide as 100m (328ft) at points, according to French media cited by the BBC.
The constraint is not only manpower. It is timing. Can crews strip vegetation, reinforce edges, and attack flames before heat and wind shift the perimeter again?
The answer changes hour by hour.
EU-wide fire data shows a season already above the long-term average
The broader European data gives the Bordeaux and Madrid fires a sharper frame. The European Commission Joint Research Centre reported that, as of 22 July 2026, 254 388 hectares (ha) had burned in the EU since the start of the year, according to JRC wildfire data.
That figure is above the long-term average, though still slightly below the 270 449 ha recorded in the same period of 2025, which JRC describes as the worst year on record for that point in the season.
The same update reported:
- Fires detected: 1 254 since the start of the year.
- Long-term average: 569 fires for the same period.
- CO₂ emissions: 8.31 million tonnes (Mt) since the start of the year.
- Comparison: below 8.48 Mt in the same period in 2025 and below the long-term average of 8.89 Mt.
Total hectares burned can mislead. A remote fire and a fire close to homes, industrial sites, transport links, or tourist areas can carry very different consequences even if their footprints look similar on a map.
That is why XOOMAR’s earlier Bordeaux coverage, including France wildfire reporting near Bordeaux, matters in context. The core risk is not just area burned. It is area burned in the wrong place, at the wrong speed, during extreme heat.
Residents, tourists, and officials are reading the same map for different risks
For residents, the first concern is binary: leave or stay. The BBC source says more than 300,000 people across France and Spain have evacuated, with more than 200,000 in Gironde alone. That scale turns fire mapping into a public safety interface.
For tourists, the issue is less abstract. The affected Bordeaux region includes lakes and borders the Atlantic ocean, according to the BBC image captions. A live fire map may show hotspots and burnt areas, but it does not replace civil-protection alerts, road instructions, or local evacuation orders.
For officials, the question is harsher: what can be defended when multiple fires burn at once?
The source supports several pressure points: aircraft availability, ground crews, military support, police coordination, firebreak construction, and worsening weather forecasts. It does not establish insurance effects, property-price moves, or claims data. XOOMAR analysis: those may become second-order consequences, but the verified story here is operational capacity and public safety, not market pricing.
The next maps will be shaped before the next heatwave, not during it
The coming week is the immediate risk. The BBC reports fears on the ground in both France and Spain that conditions could worsen, with high pressure forecast to bring dry, settled, increasingly hot weather.
The deeper signal is more uncomfortable. Europe cannot aircraft-drop its way out of fires that move this fast, generate their own thunderstorms, and threaten urban edges, military facilities, industrial sites, farms, forests, and holiday regions at the same time.
The evidence that would confirm this thesis is clear: more large burnt-area perimeters appearing during heatwaves, more simultaneous high-risk regions on EFFIS and Copernicus maps, and more evacuations before crews can stabilize firebreaks. Evidence that would weaken it would be sustained containment despite hot, dry conditions and fewer fires pushing into populated or strategic zones.
For now, the European wildfires in maps story points to one practical conclusion: prevention, land management, early warning, and evacuation planning now decide how much damage the next fire map records. Firefighting still matters. But the decisive work starts before the flames appear.
Impact Analysis
- More than 300,000 people have been forced to evacuate across France and Spain.
- The Gironde fire near Bordeaux burned more than 162 sq miles in less than four days.
- Satellite maps can aid emergency response, but delays and visibility limits mean they are not live fire feeds.
How wildfire map signals differ
| Map signal | What it shows | Why it matters |
|---|---|---|
| Active-fire hotspots | Satellite-detected intense heat | Helps identify where fire activity may be occurring now |
| Burnt-area perimeters | Areas already consumed by fire | Shows the scale of damage and how far the fire has spread |
Satellite detection resolution used in European wildfire mapping
Primary Sources & Disclosures

Written by
XOOMAR Insights Team
Research and Editorial Desk
The XOOMAR Insights Team pairs automated research with human editorial judgment. We track hundreds of sources across technology, fintech, trading, SaaS, and cybersecurity, cross-check the facts, and explain what happened, why it matters, and what to watch next. We do not just rewrite headlines. Every article is fact-checked and scored for reliability before it goes live, and we link back to the original sources so you can verify anything yourself.